


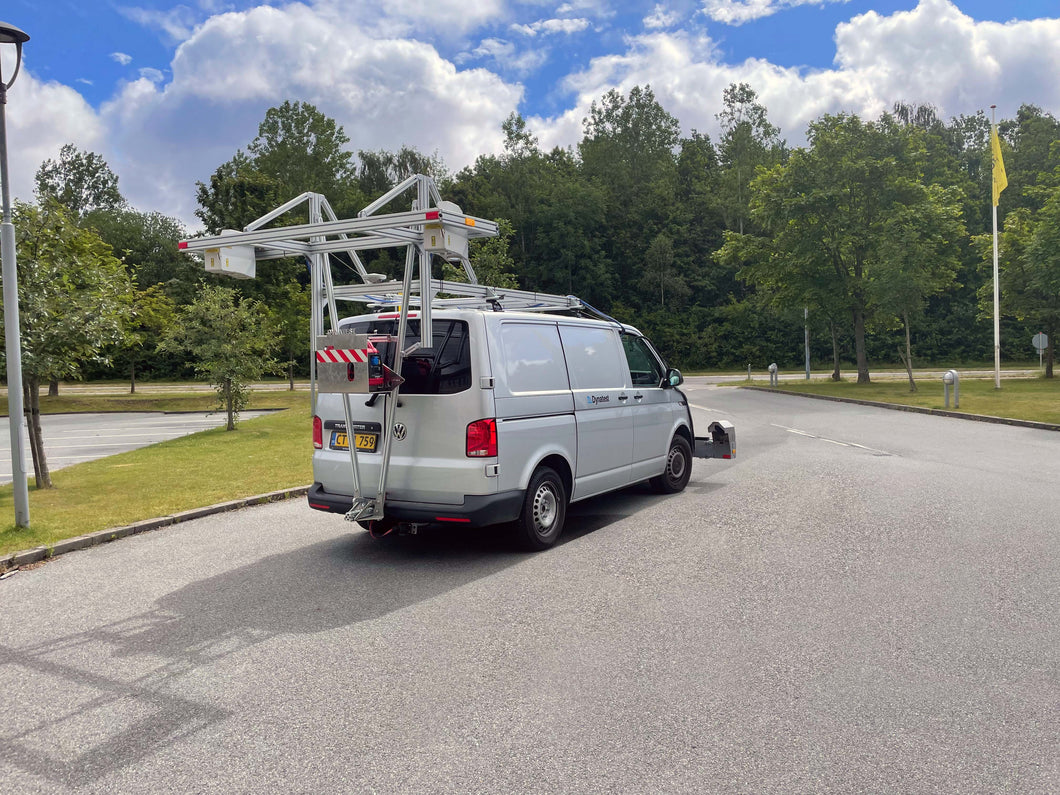


Multi Functional Vehicle
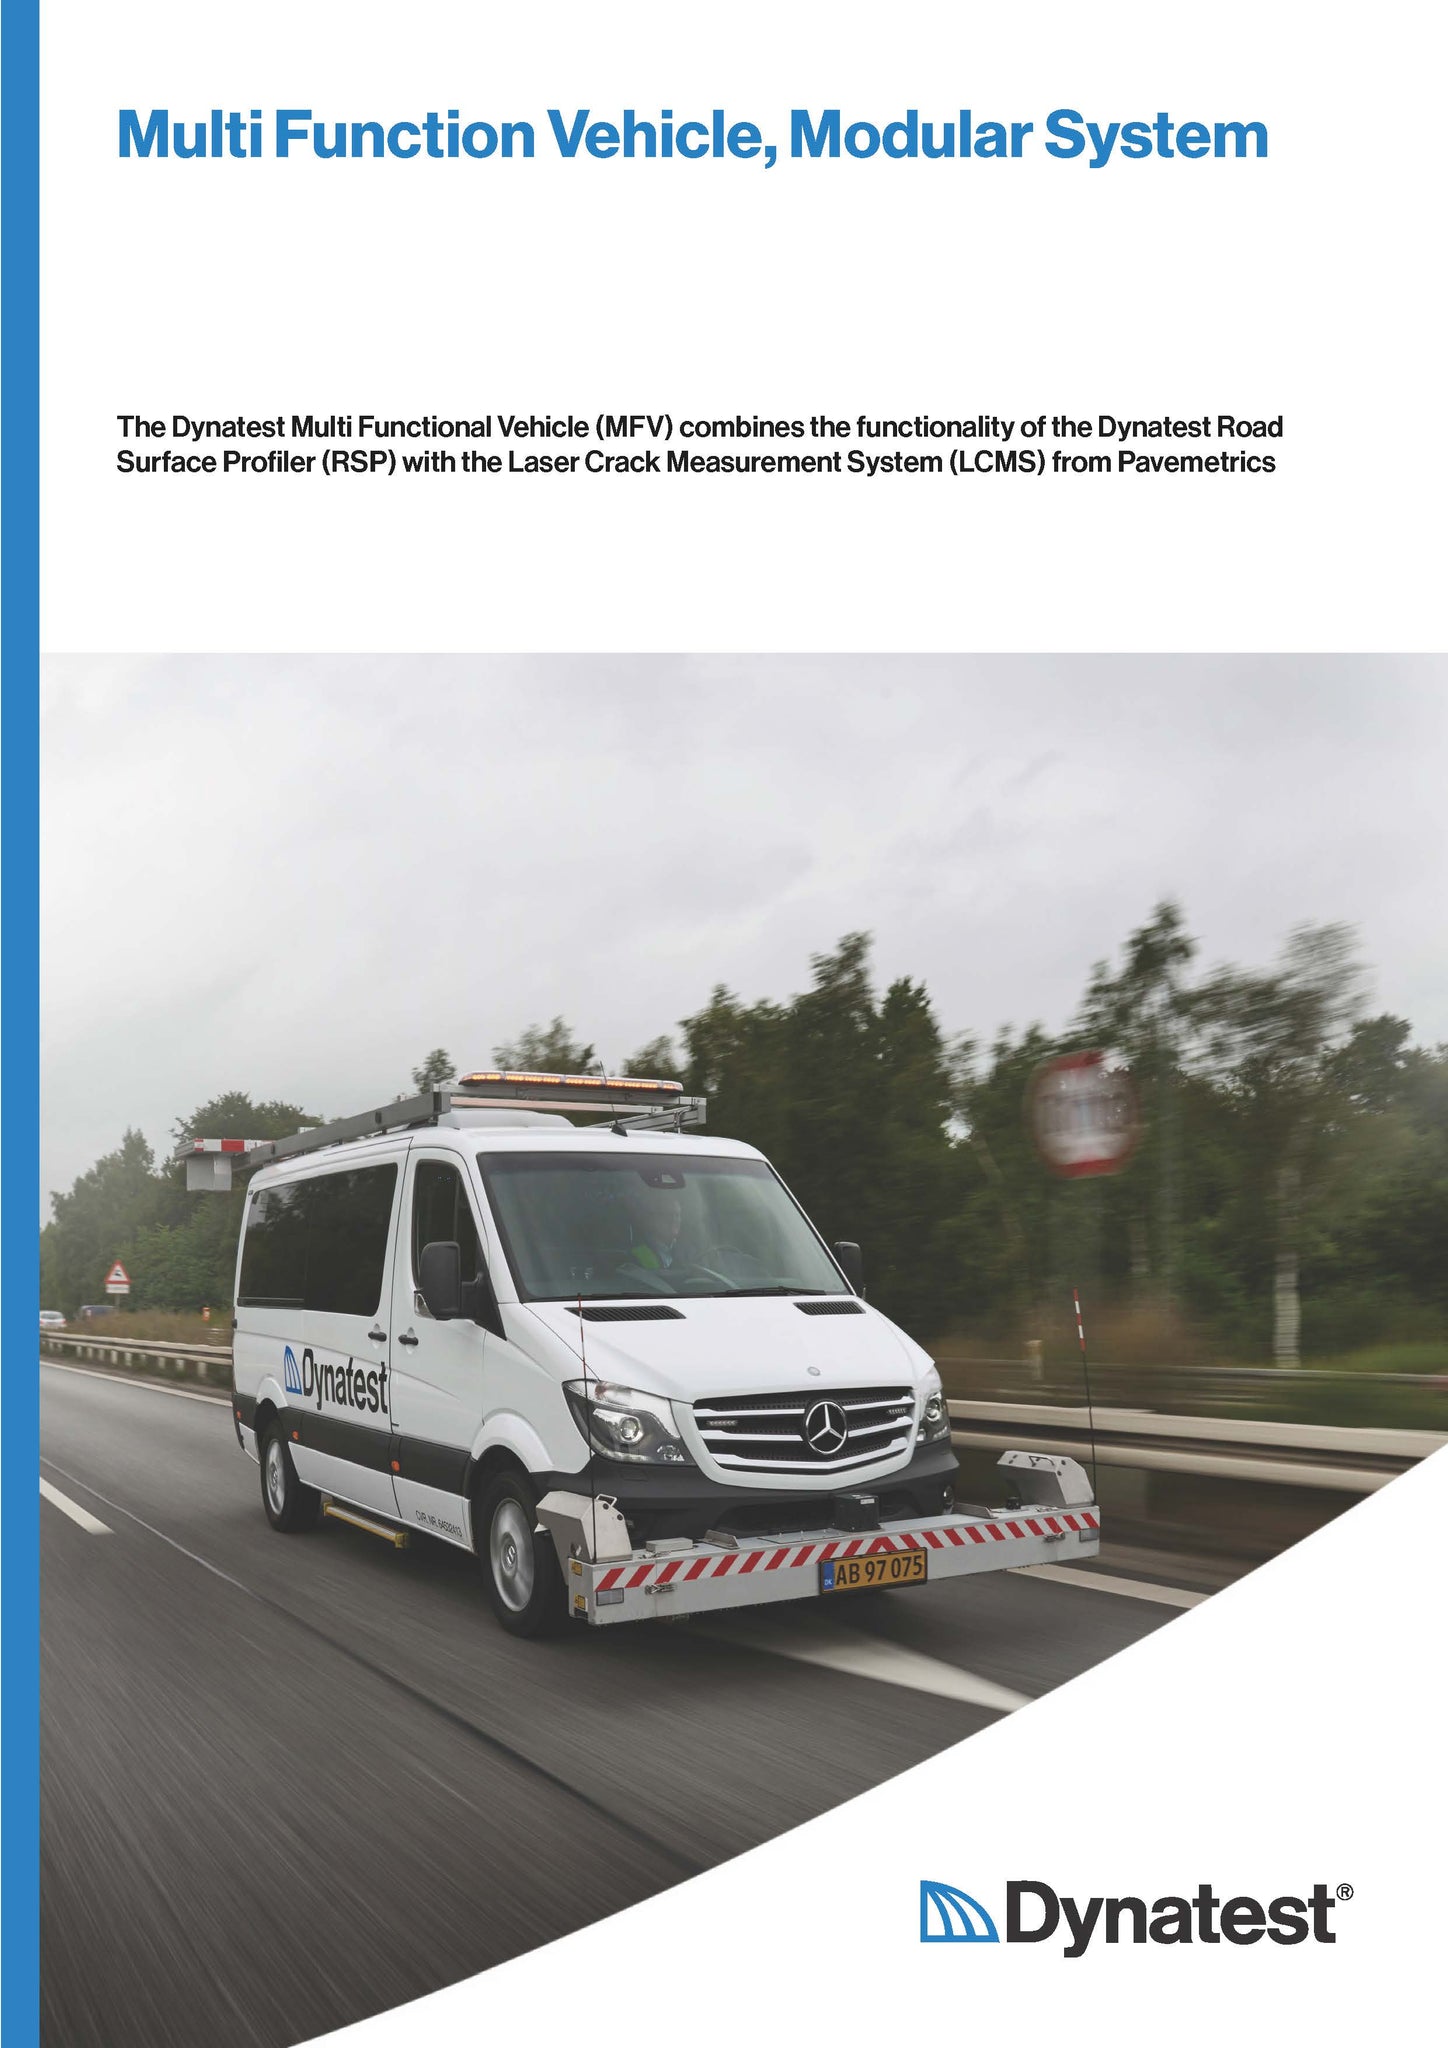
The Multi Functional Vehicle (MFV) combines the Road Surface Profiler with the Laser Crack Measurement System (LCMS) from Pavemetrics, offering a comprehensive solution for pavement surveys.
The MFV enables the measurement of various parameters such as IRI/RN, longitudinal and transverse profile, macrotexture, traveling, and geometrics (including crossfall, gradient, and radius of curvature).
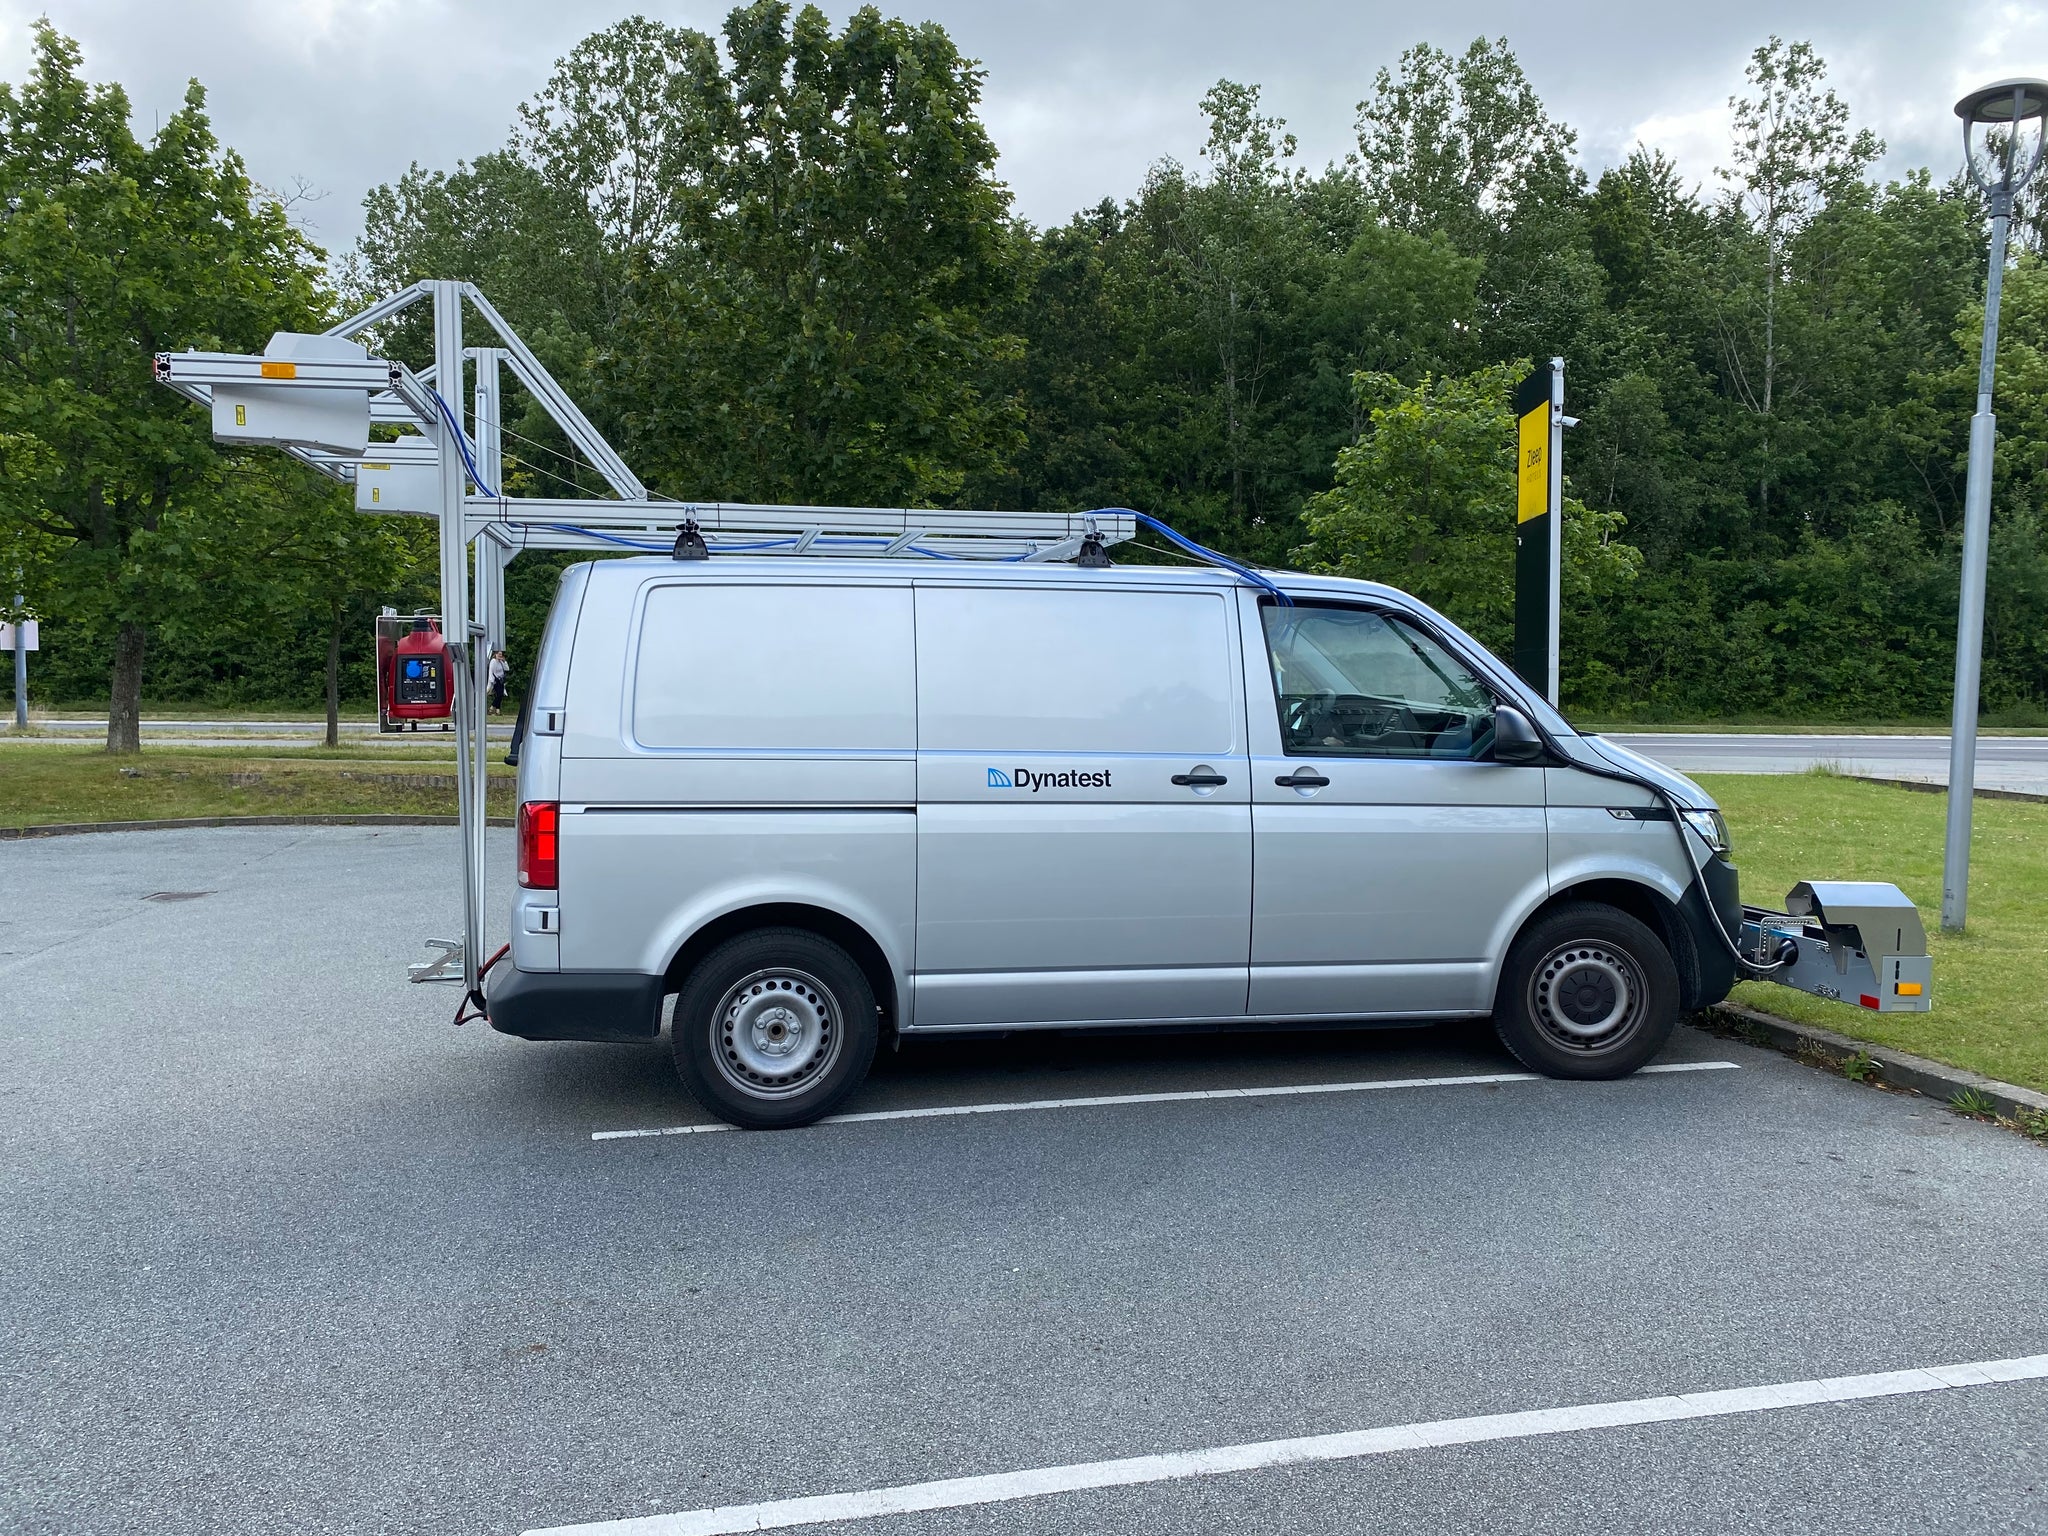
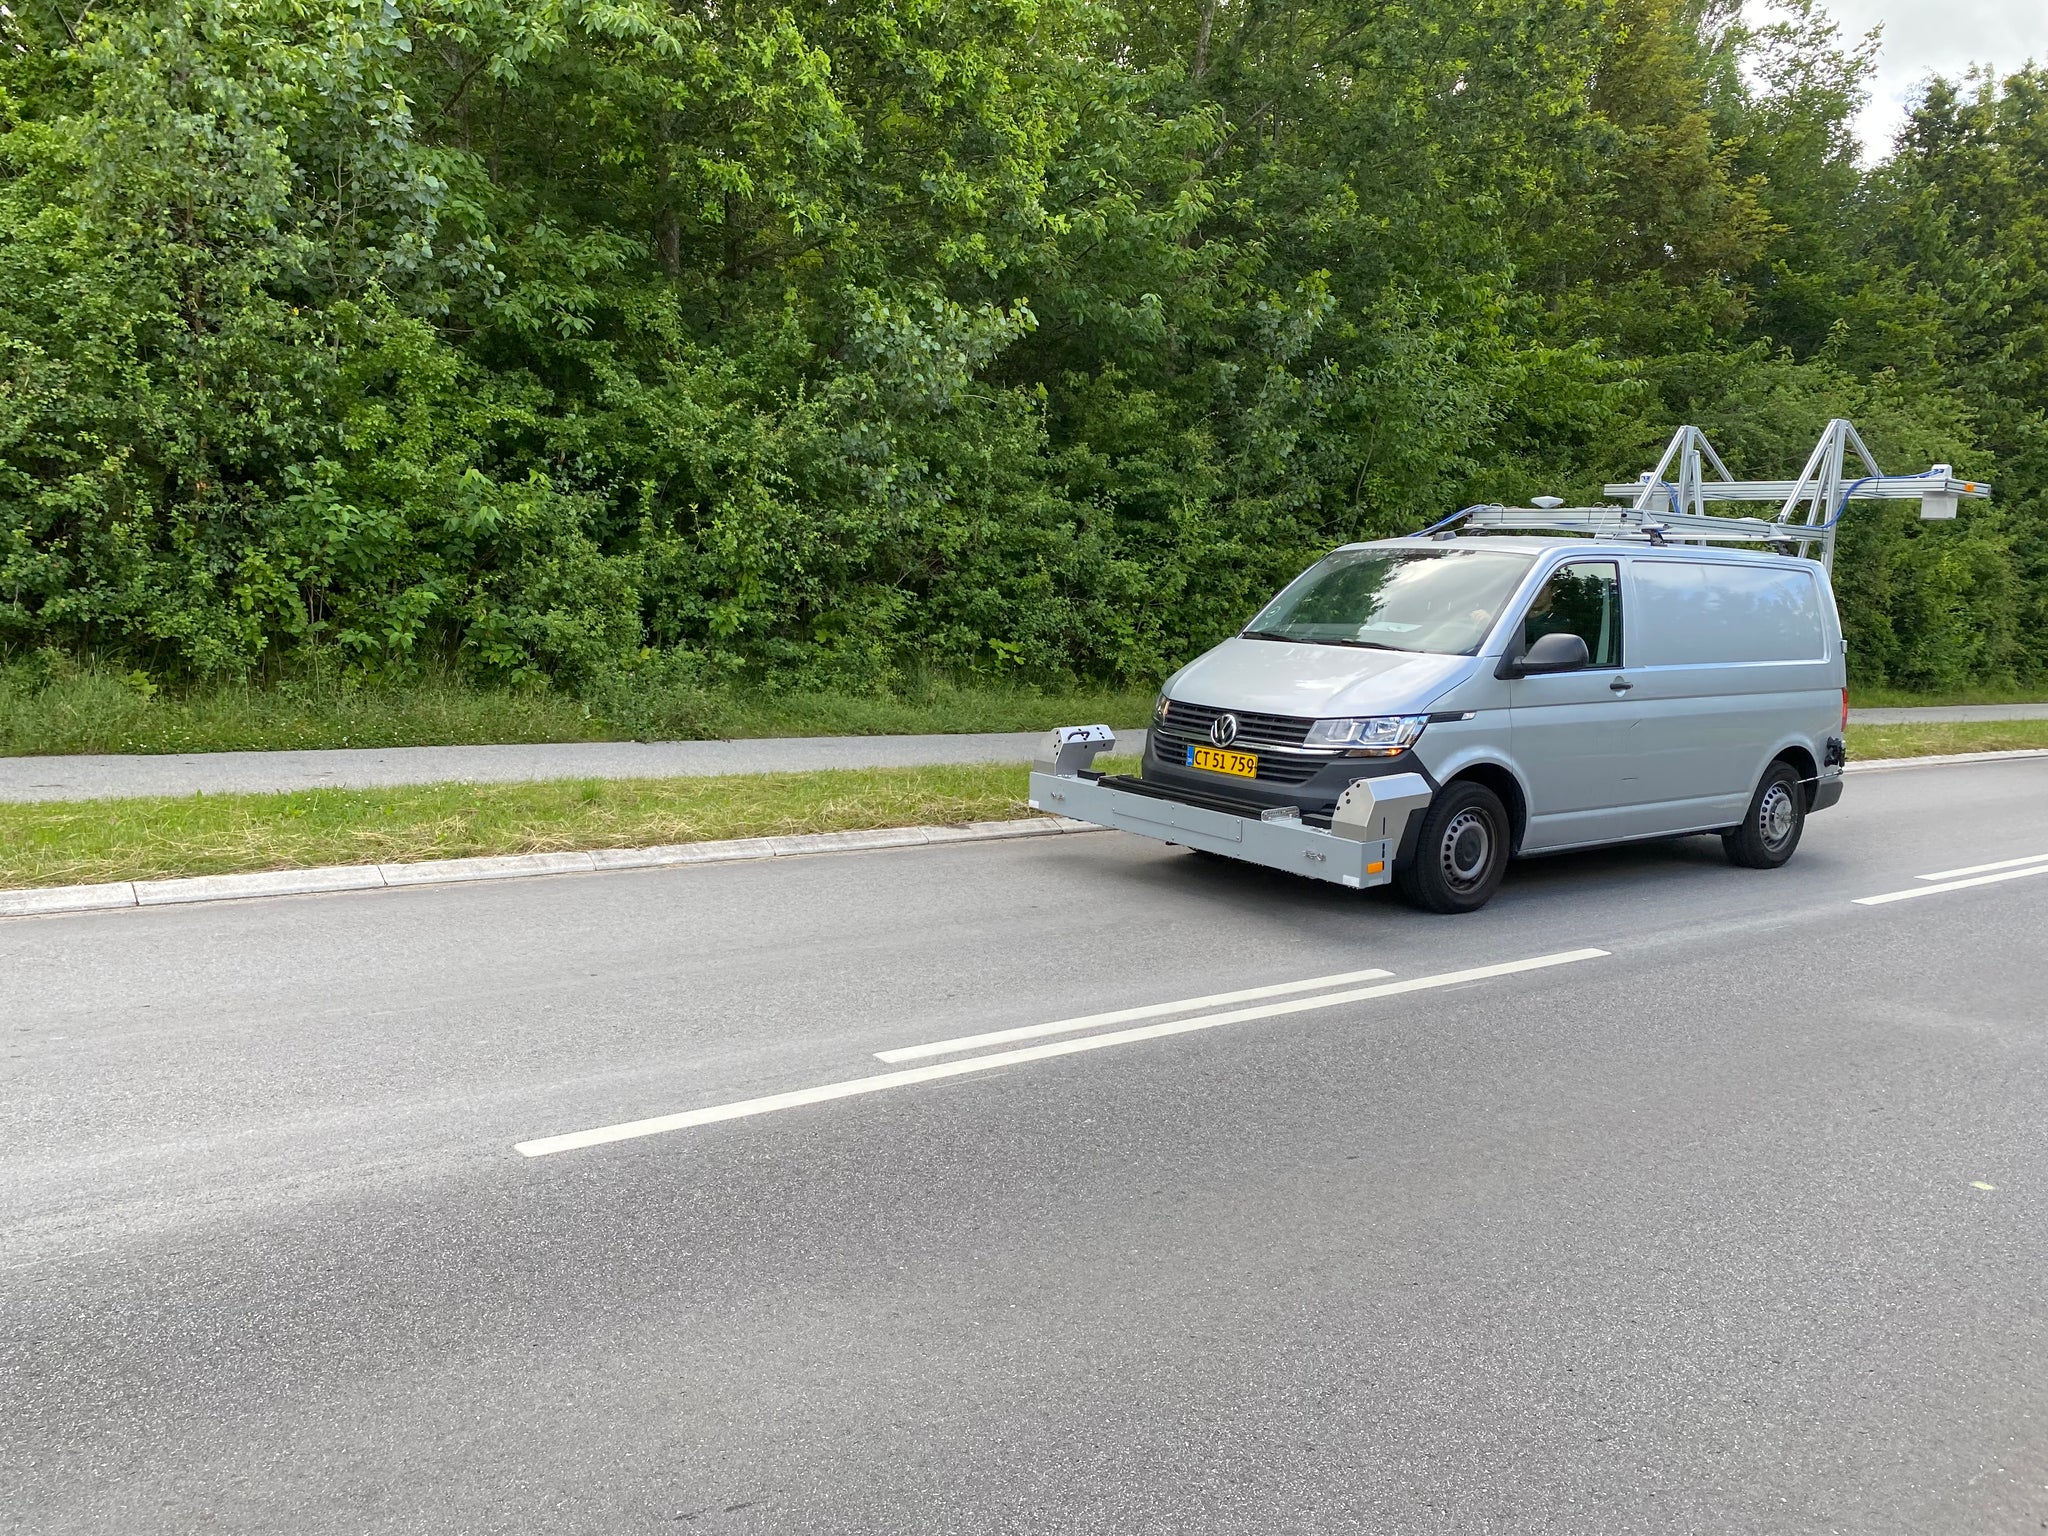
With the LCMS, it provides 3D or 2D pavement imagery across a 4m width, facilitating rapid and accurate crack detection and classification. Additionally, up to 8 Right of Way cameras capture a complete view of the road and assets. This vehicle prioritises safety by allowing surveys to be conducted at normal traffic speeds, eliminating the need for traffic management, day or night.
The Multi Functional Vehicle is a specially designed van or pickup truck that accommodates different equipment and technologies for pavement surveys on roads and airports. It enables simultaneous execution of various pavement tests. Users have flexibility in choosing a van or truck within specified parameters, at their own expense.
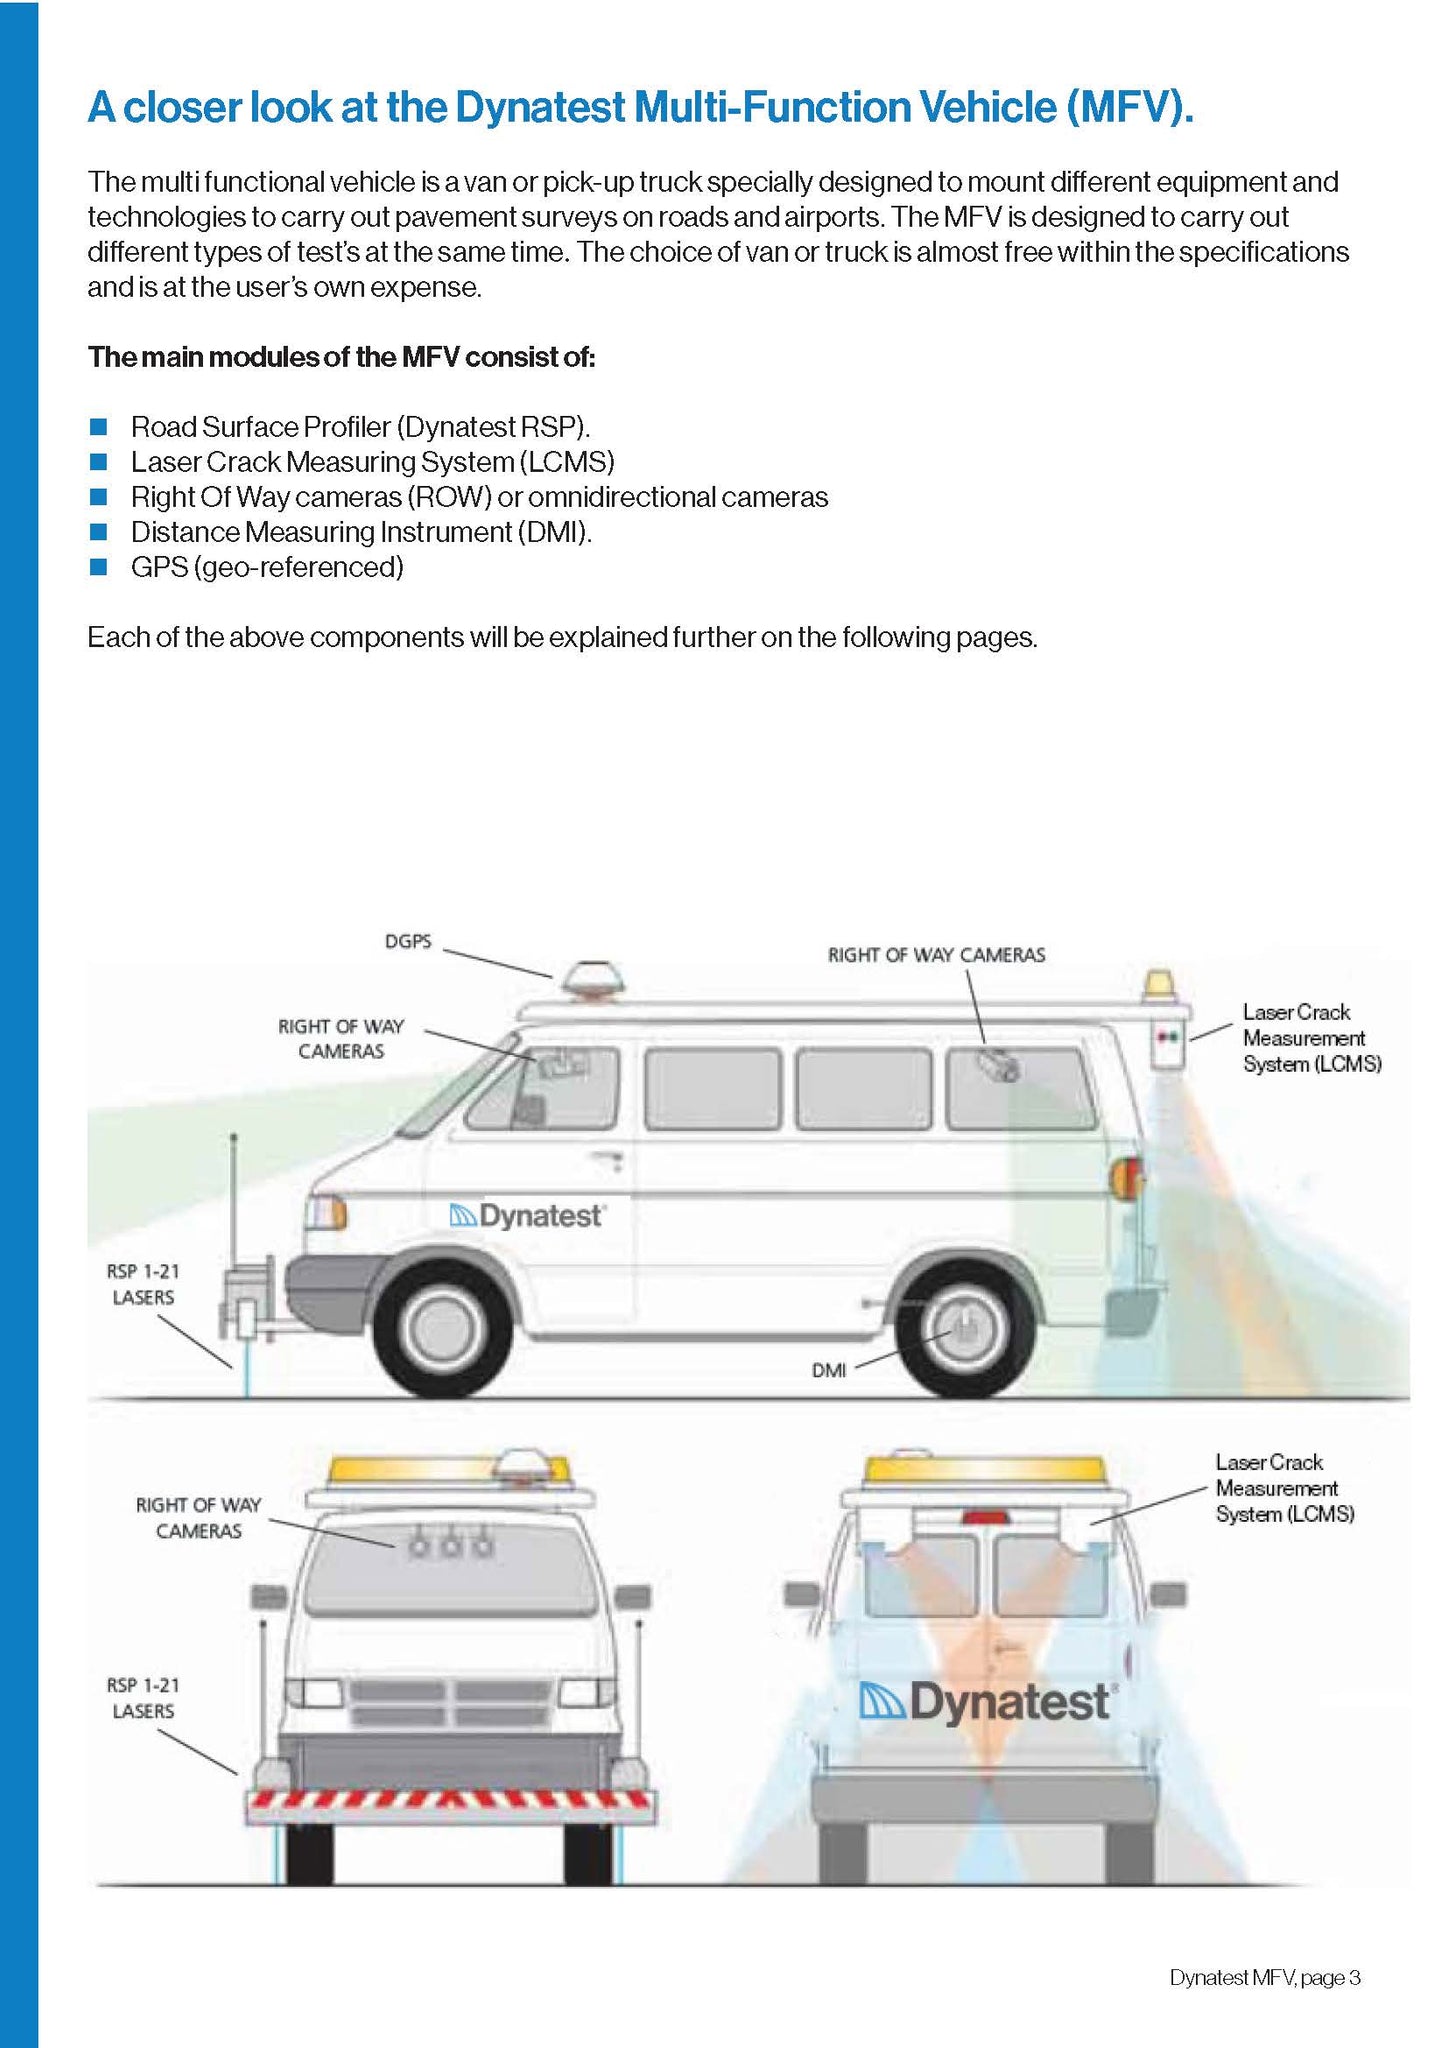
The MFV consists of the following modules:
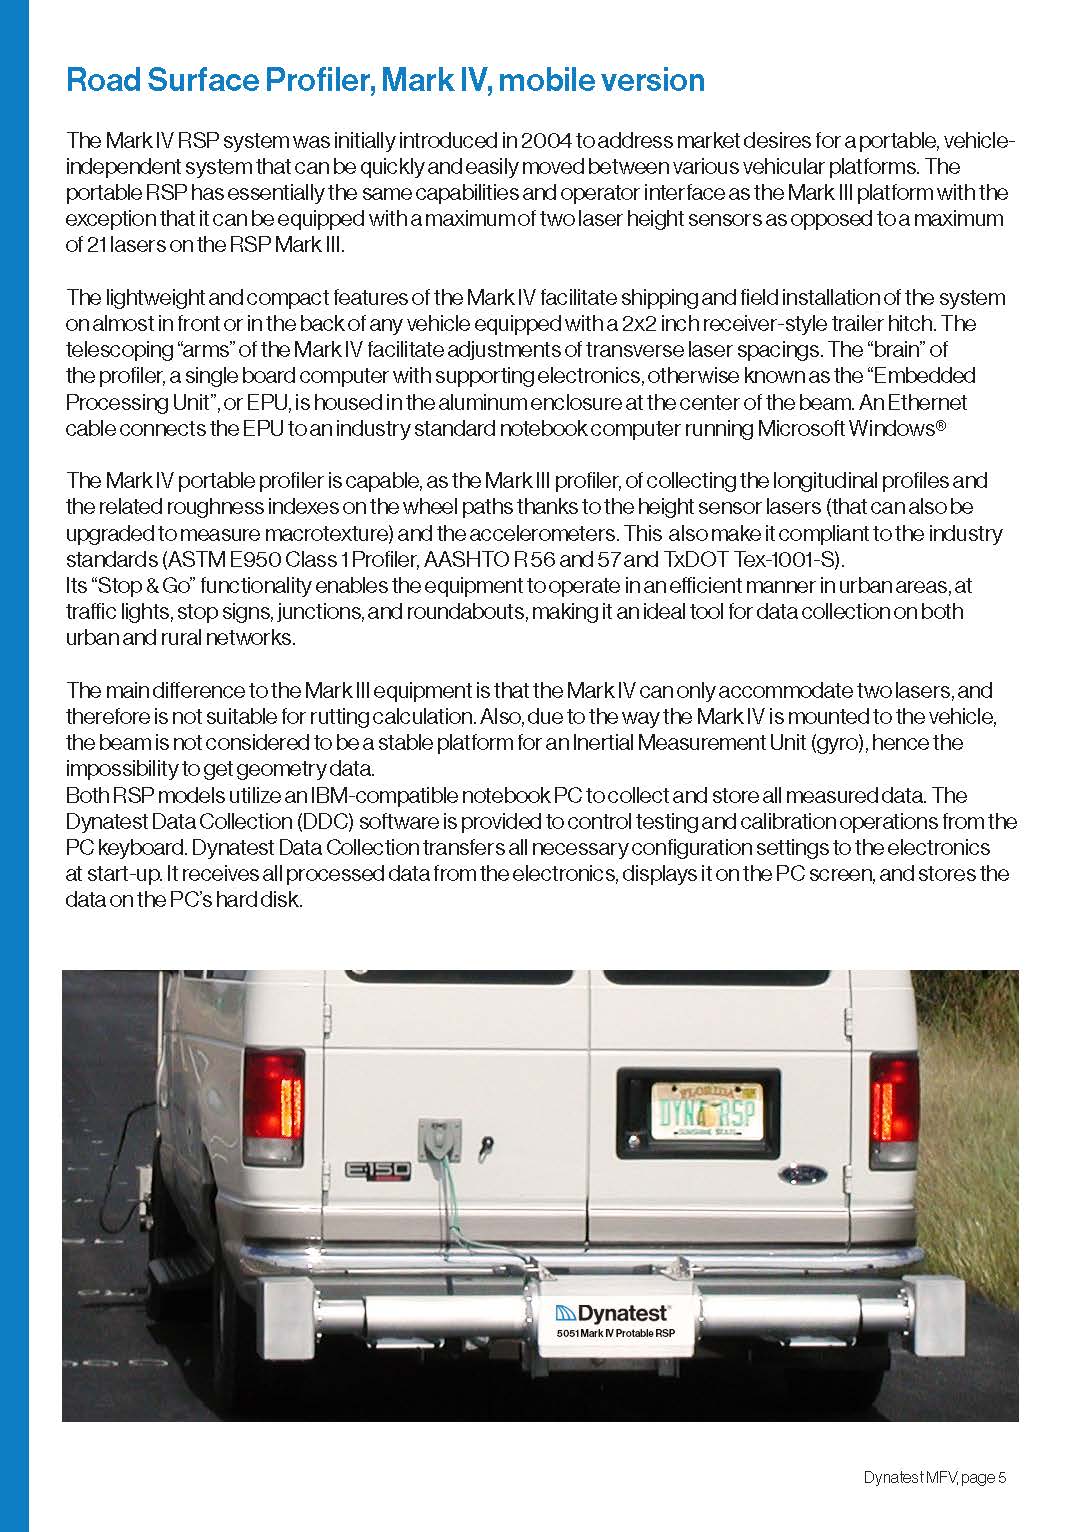
- Road Surface Profiler (Dynatest RSP).
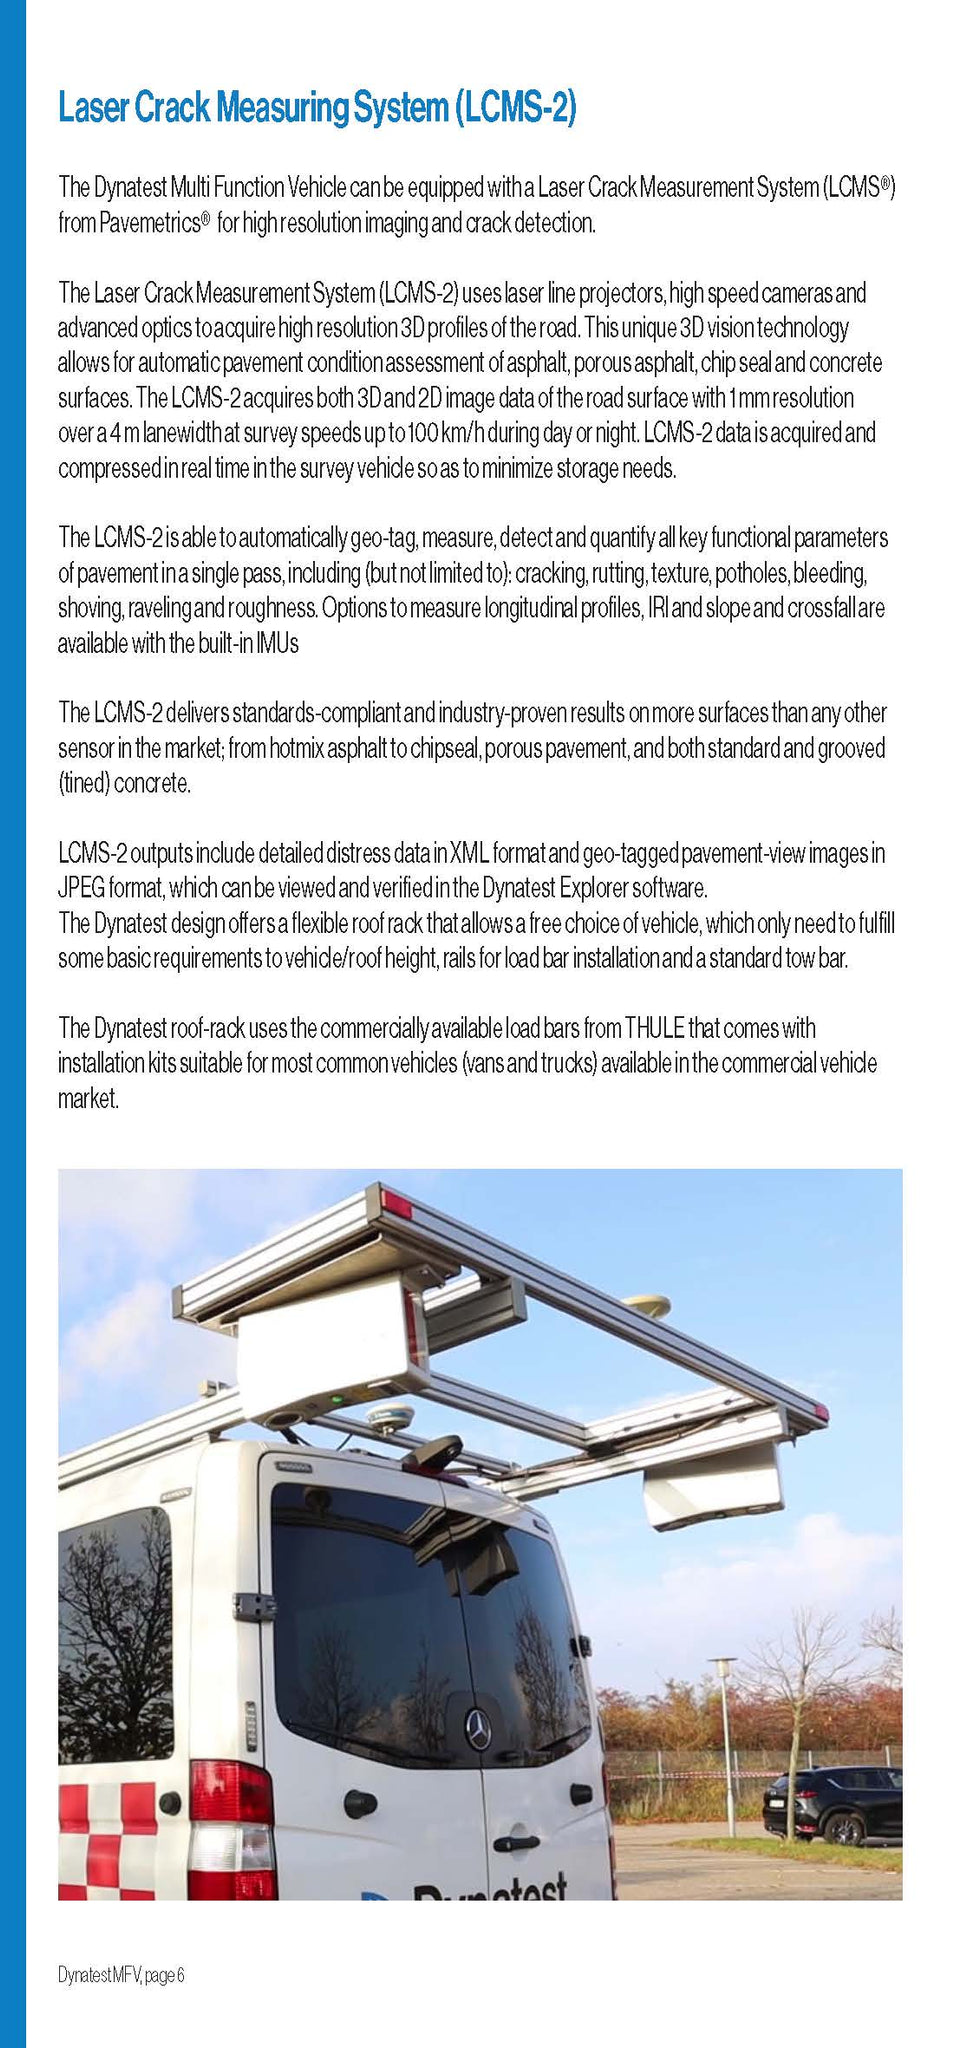
- Laser Crack Measuring System (LCMS).
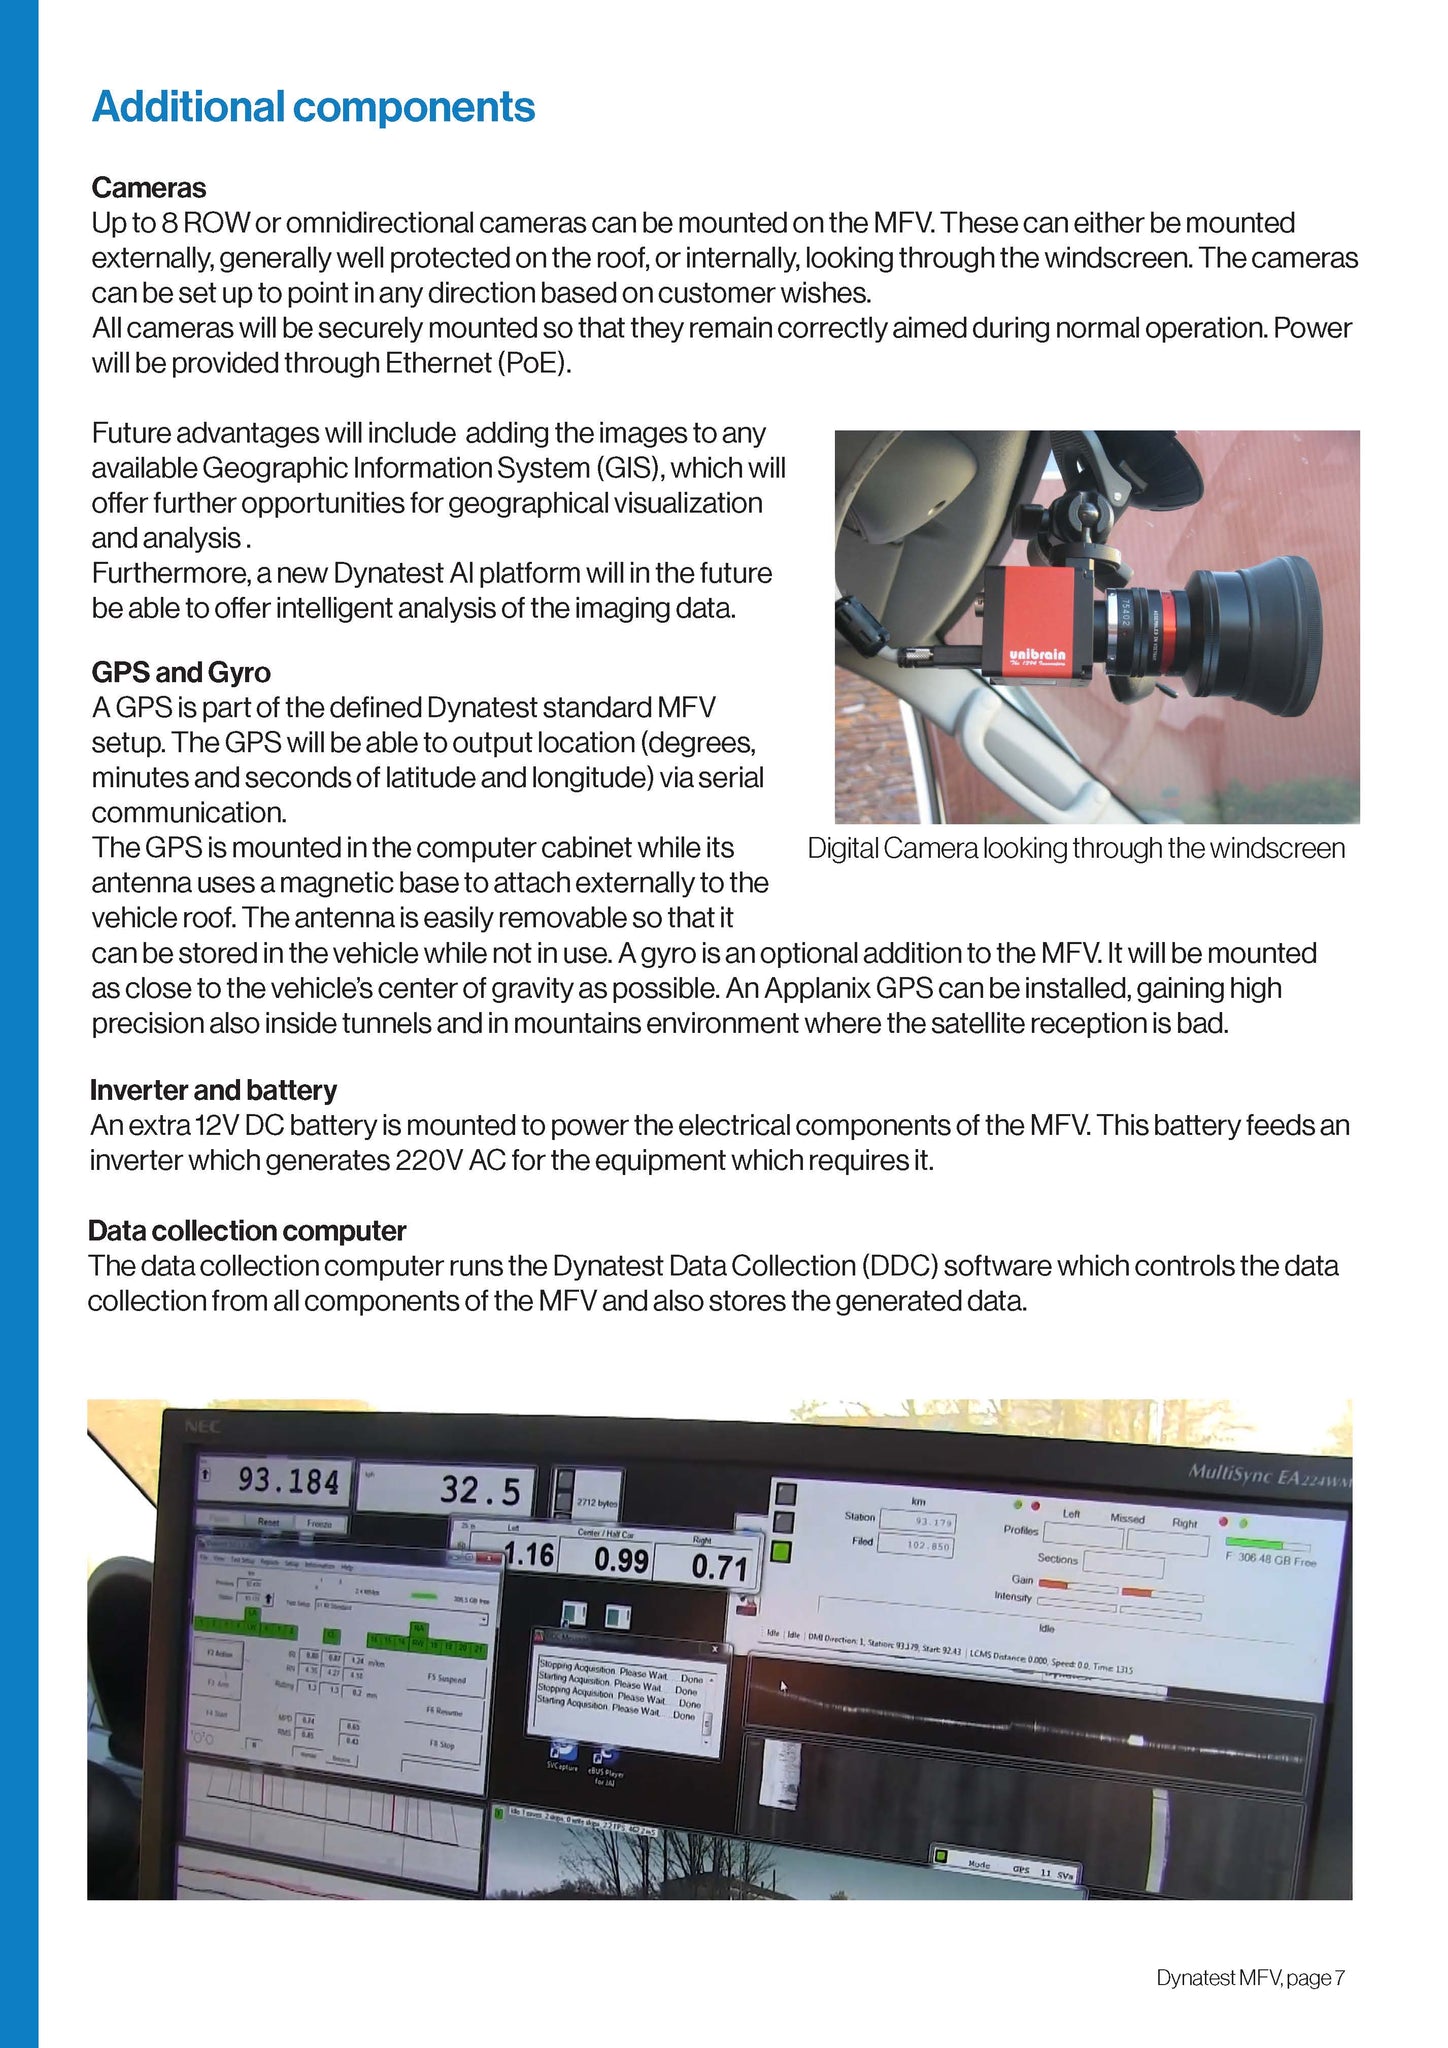
- Right Of Way cameras (ROW) or omnidirectional cameras.
- Distance Measuring Instrument (DMI).
- GPS (geo-referenced).
Each Dynatest MFV is configured with the appropriate combination of these technologies based on the specific pavement data collection goals and objectives of the user.
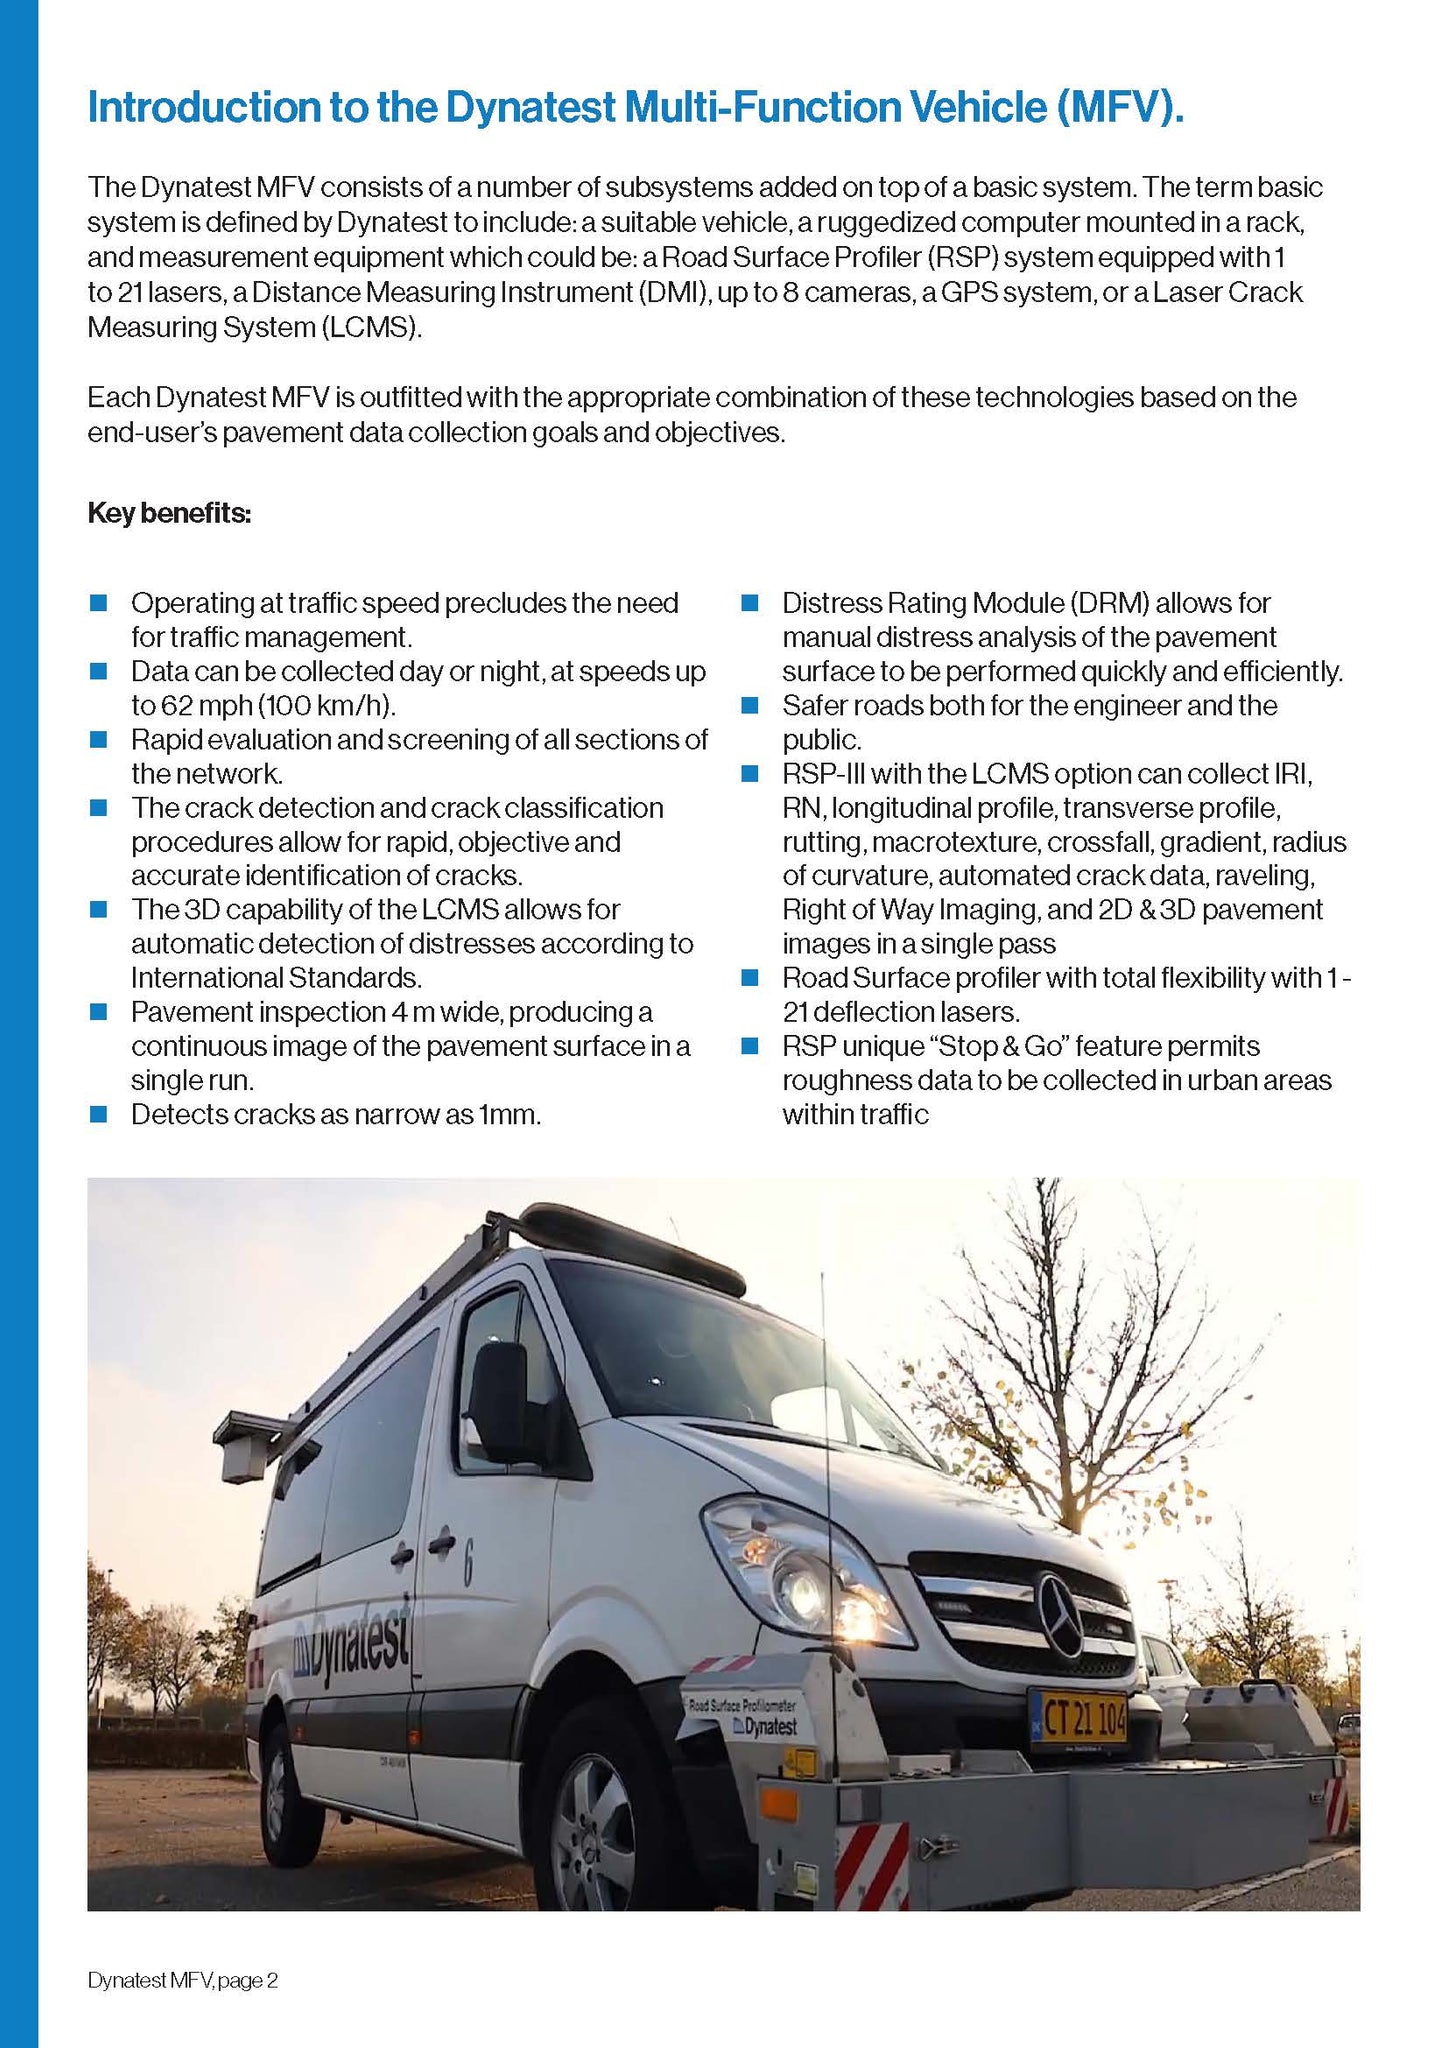
Key Benefits of the Multi Functional Vehicle:
- Surveys can be conducted at traffic speeds, eliminating the need for traffic management.
- Data collection is possible day or night, at speeds up to 62 mph (100 km/h).
- Rapid evaluation and screening of the entire network.
- Objective and accurate identification of cracks through efficient crack detection and classification procedures.
- LCMS's 3D capability allows for rating of raveling.
- Wide 4m pavement width coverage provides a continuous image of the pavement surface in a single run.
- Detection of cracks as narrow as 1mm.
- The Dynatest Rating Module (DRM) enables quick and efficient manual distress analysis of the pavement surface.
- Enhanced road safety for engineers and the public.
- RSP-III with the LCMS option can collect IRI, RN, longitudinal profile, transverse profile, crossfall, gradient, radius of curvature, automated crack data, raveling, macro texture, Right of Way Imaging, and 3D & 2D pavement images in a single pass.
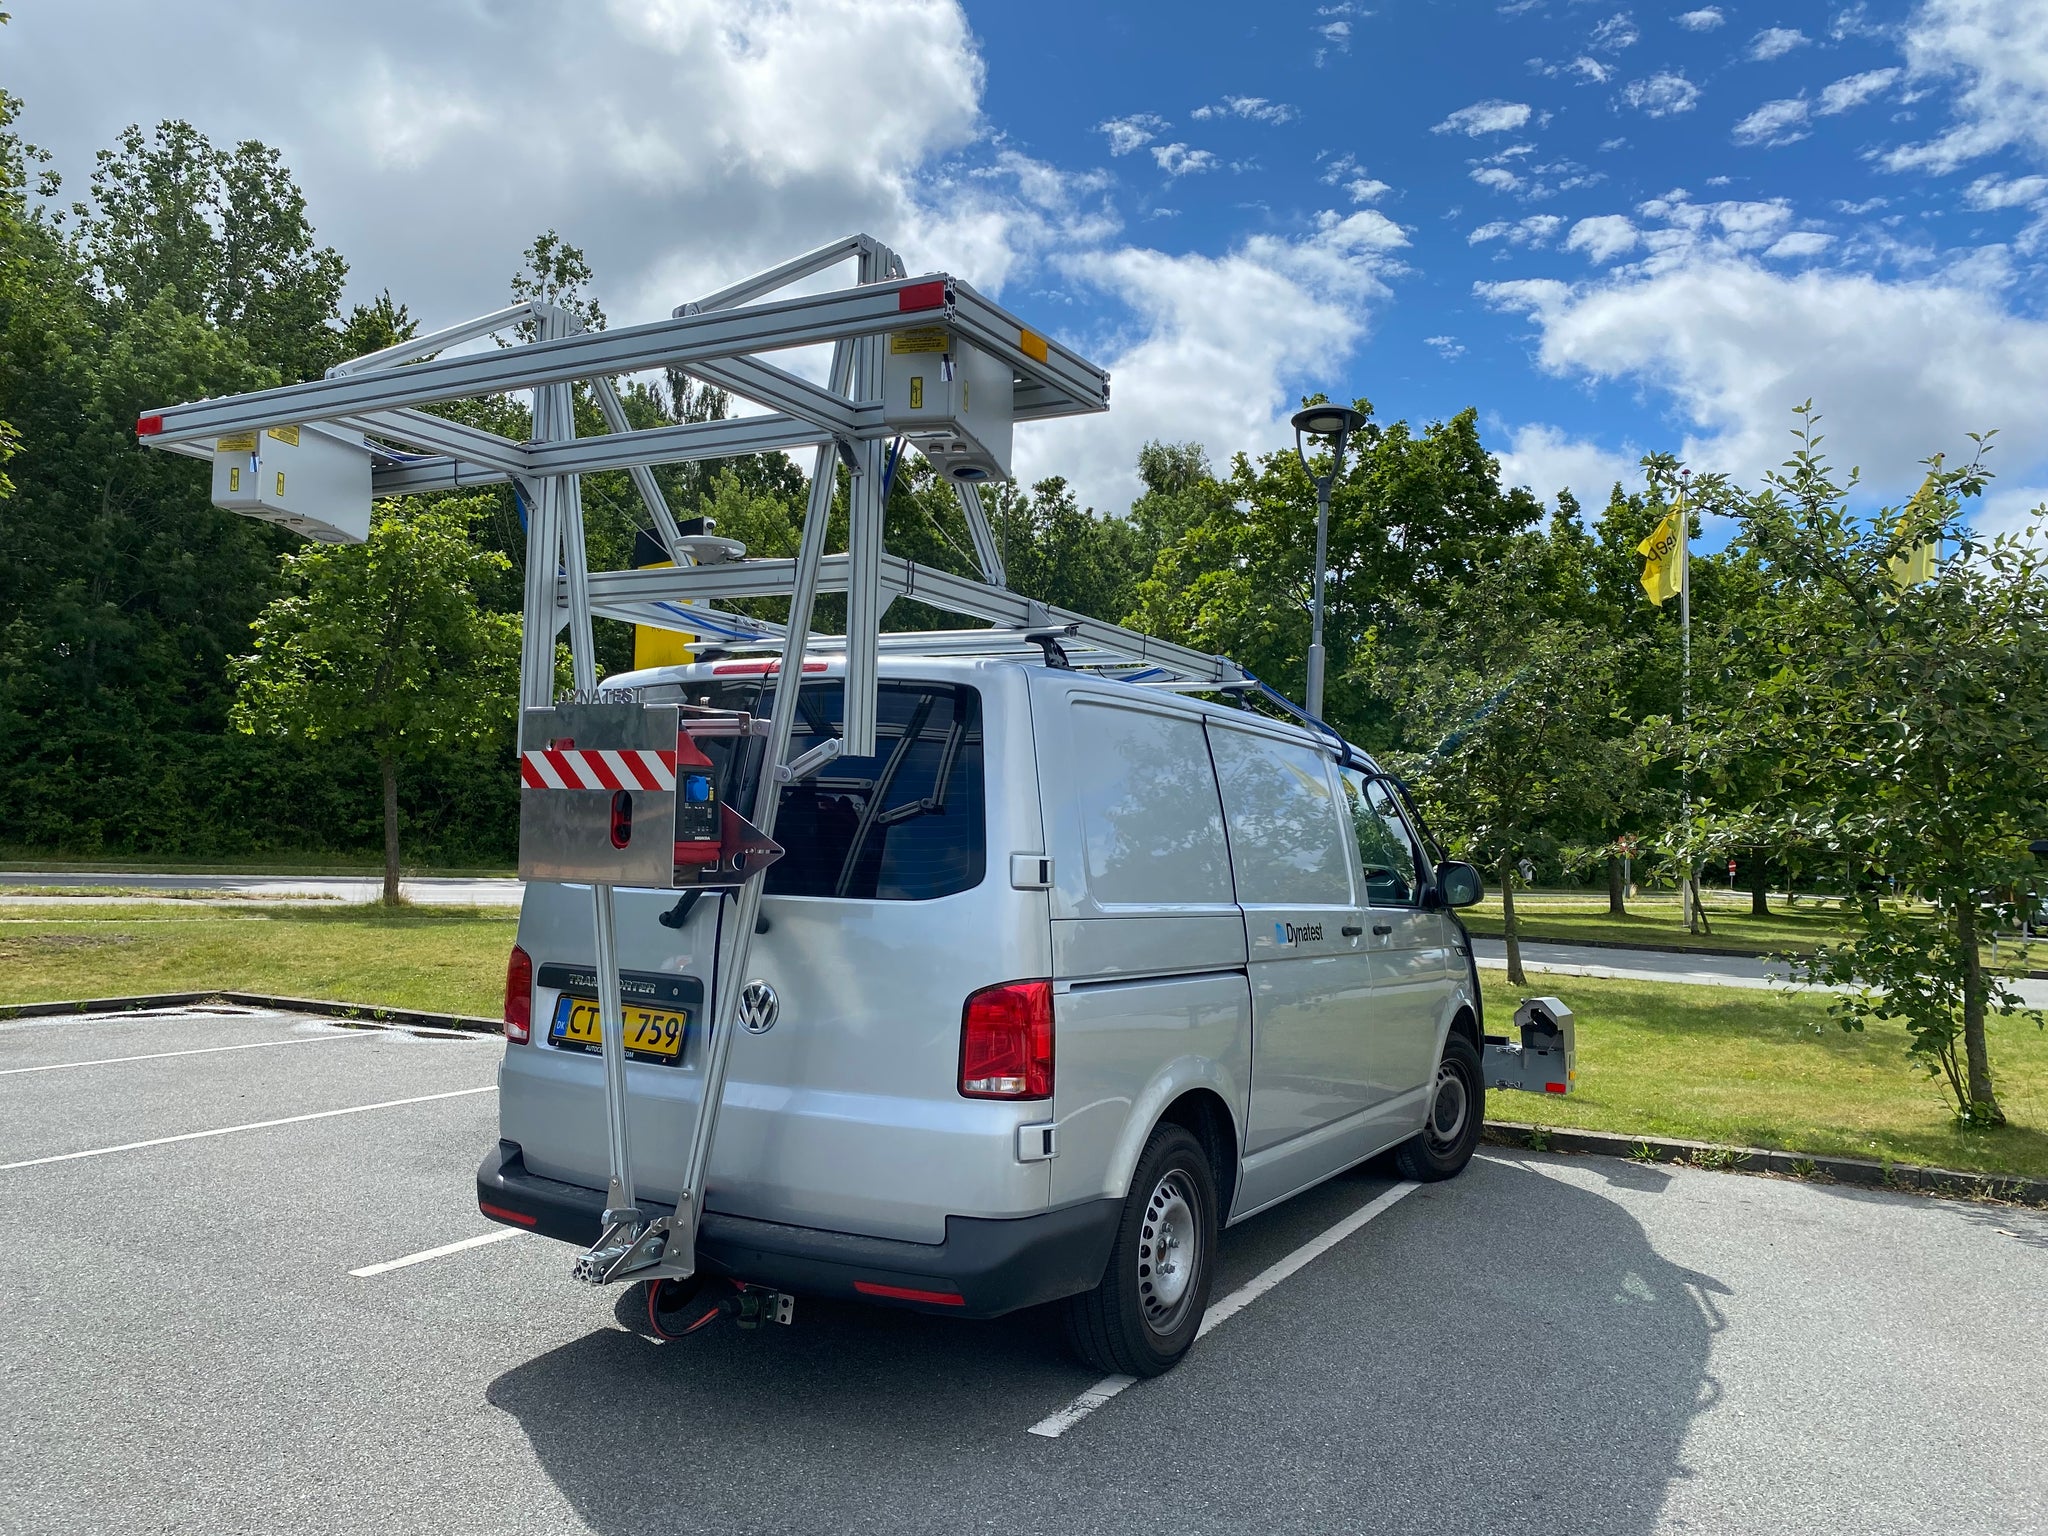
Get a closer look at the Dynatest Vehicle
The Dynatest MFV consists of a number of subsystems added on top of a basic system. The term basic system is defined by Dynatest to include: a suitable vehicle, a ruggedised computer mounted in a rack, and measurement equipment which could be: a Road Surface Profiler (RSP) system equipped with 1 to 21 lasers, a Distance Measuring Instrument (DMI), up to 8 cameras, a GPS system, or a Laser Crack Measuring System (LCMS).
Each Dynatest Multi Functional Vehicle is outfitted with the appropriate combination of these technologies based on the end-user’s pavement data collection goals and objectives.
The special Stop & Go function
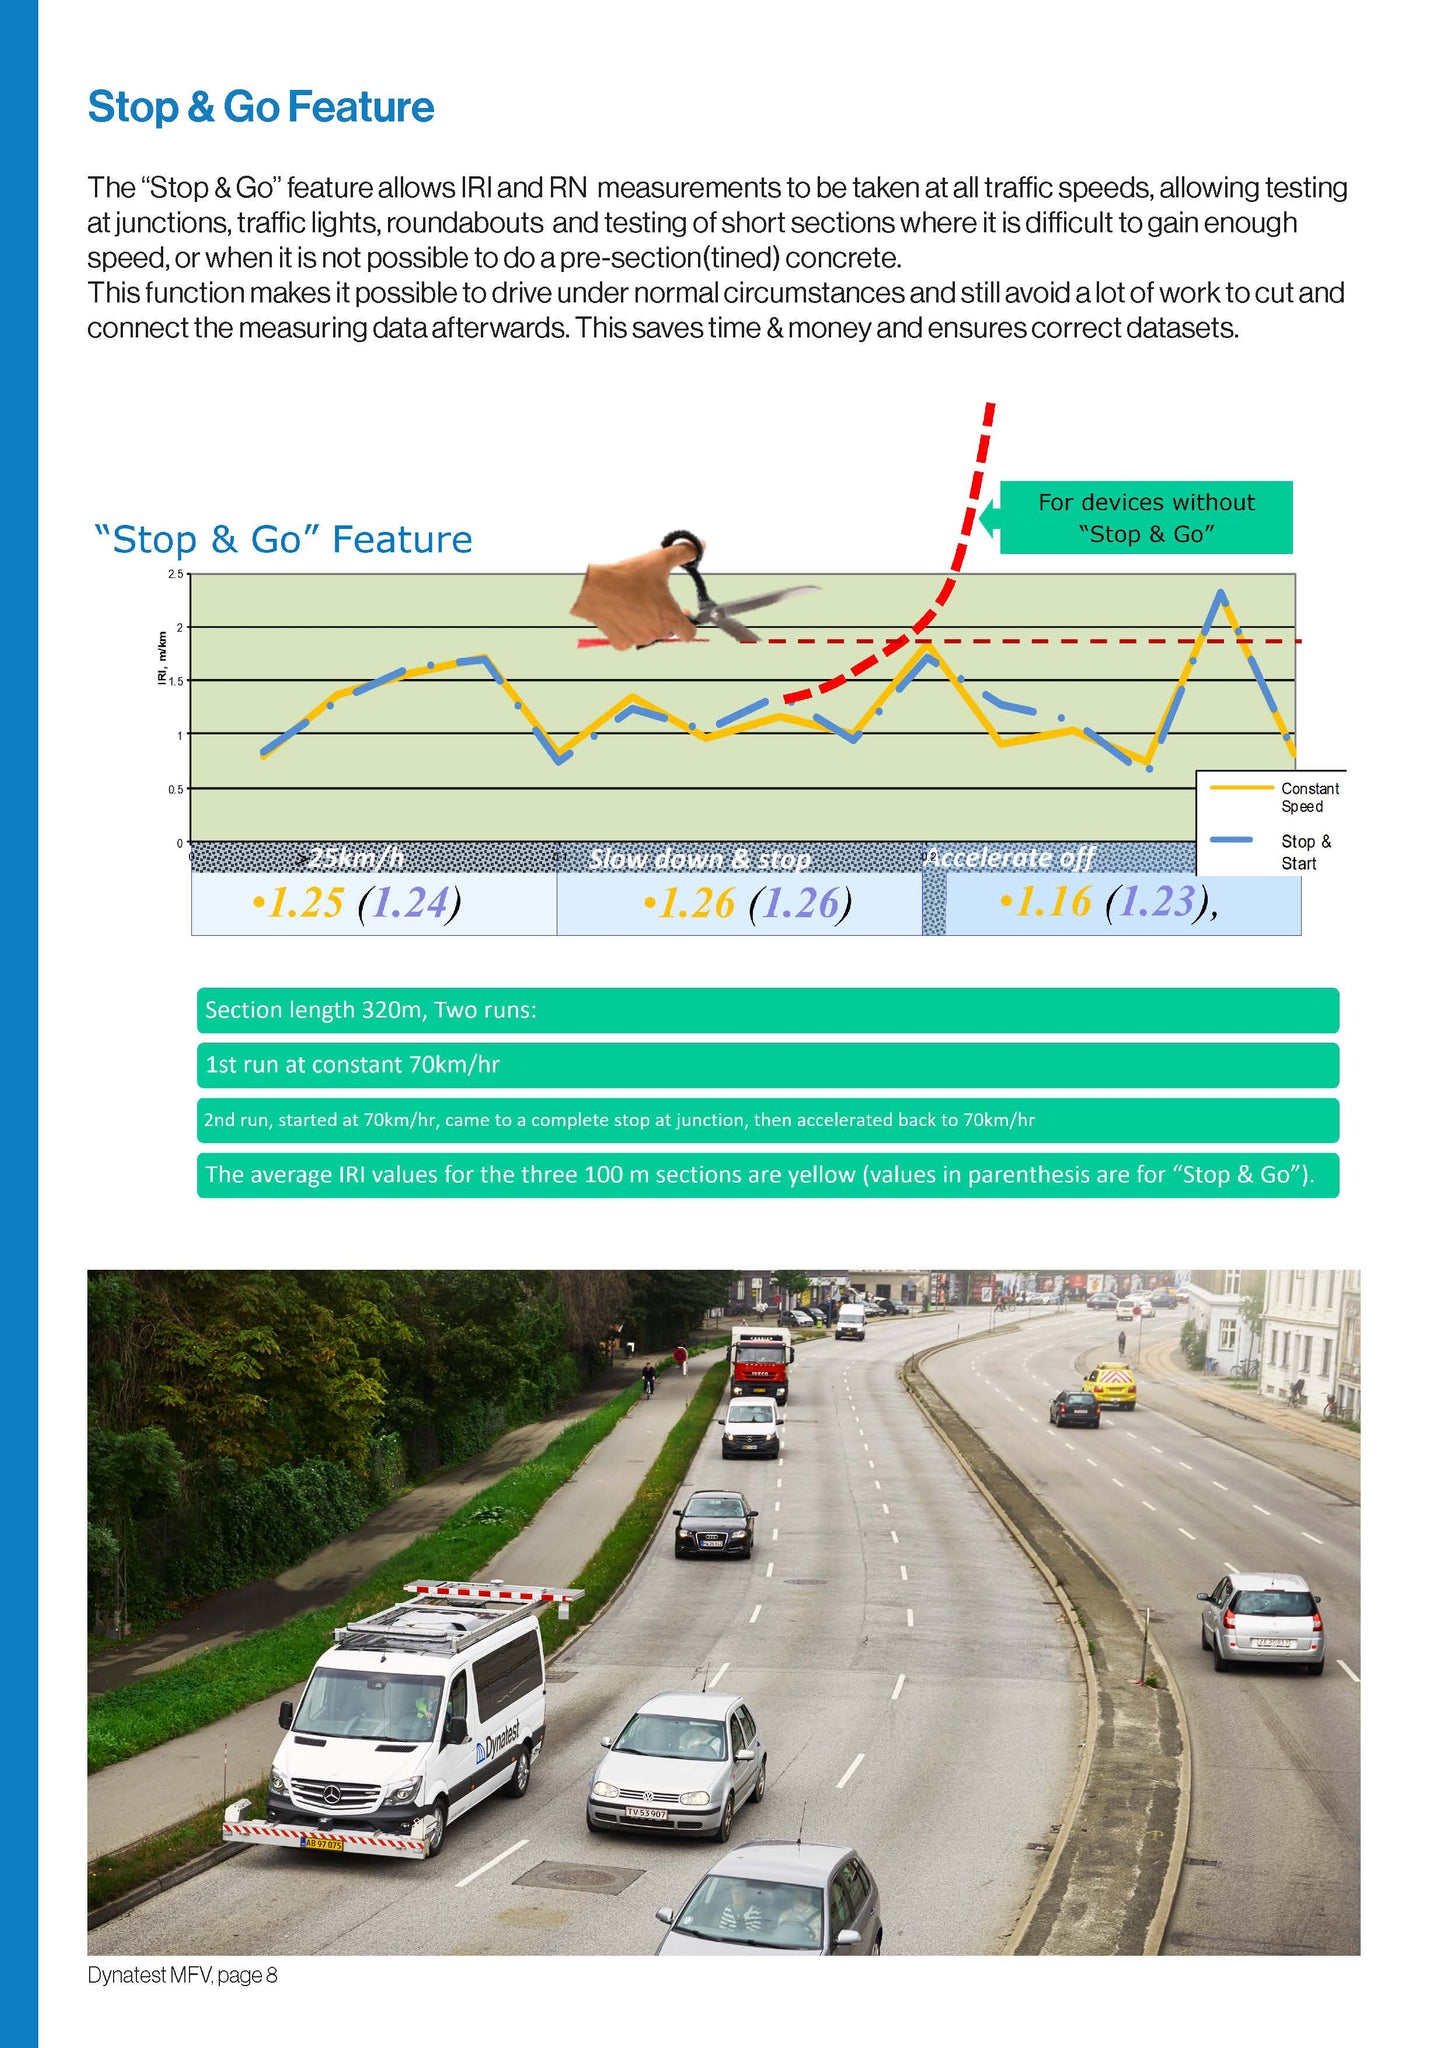
The “Stop & Go” feature within the Dynatest Road Surface Profilers allows IRI and RN measurements to be taken at all traffic speeds, allowing testing at junctions, traffic lights, roundabouts and testing of short sections where it is difficult to gain enough speed, or when it is not possible to do a pre-section(tined) concrete.
This function makes it possible to drive under normal circumstances and still avoid a lot of work to cut and connect the measuring data afterwards. This saves time & money and ensures correct datasets. No need for rubber banding” and no need for calculating averages.
Without this function it is impossible to test section of pavements less than 150 meter long or areas where speed has to be reduced below 15-20 km/h such as junctions and roundabouts. It has been shown that without “Stop & Go”, the road owner may not be able to collect data on up to 1/3 of the pavement network.
See the Multi Functional Vehicle in action - click on the picture on the right to see the video
There are various ways to collect road distress and smoothness data. For many years a manual survey of the road network has been performed, where the long stretches of roads have been evaluated by eye and often on foot. This method represents a curtain safety risks for the person in charge of the evaluation, a high risk of subjectivity of the evaluated data, and a very labor intensive and high disruptive method.
The Dynatest Multi Functional Vehicle offers an automated road survey method. The benefits of an automated road functional and condition survey represent a very fact-based and objective method with low safety risk for the person in charge of the evaluation, very little disruption (if any) and with the ability to record much more data than the eye caption. The automated survey is also ensuring that more people have direct access to the data. Furthermore, the data collection software, Dynatest Data Collection, together with the post data analysis software, Dynatest Explorer, ensures an easy access to key values as IRI, RN, and PCI.
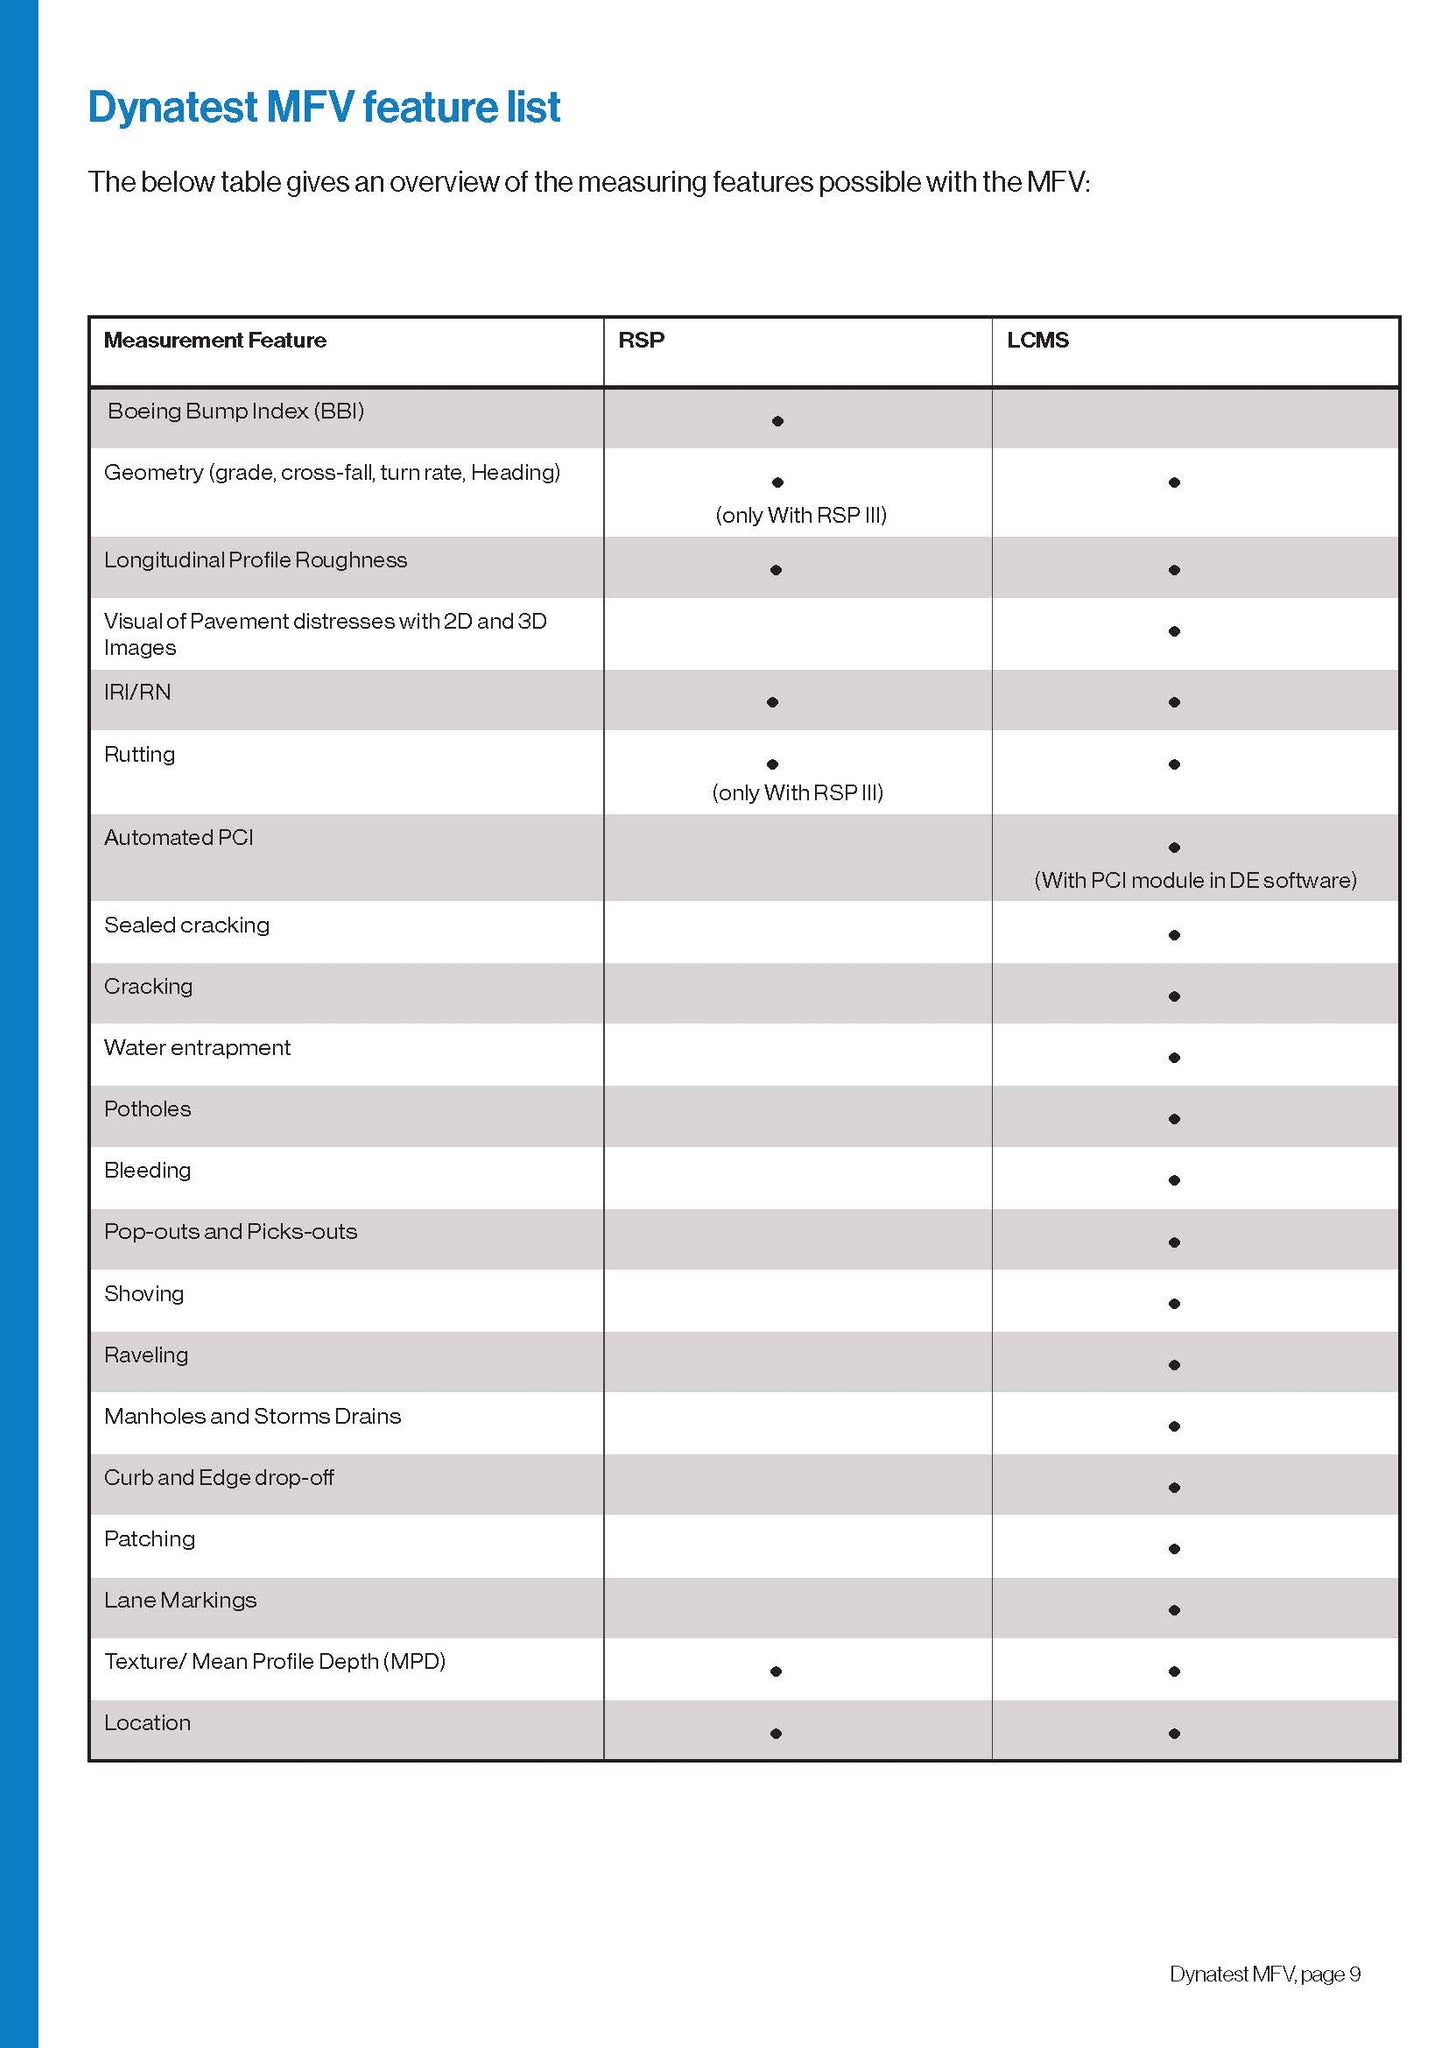
The Measurement Parameters using MFV with a Road Surface Profiler
Longitudinal Profile, IRI and Ride Number
The longitudinal profile elevation measurements are obtained by using an accelerometer to monitor vertical vehicle body movement, and a laser sensor for measuring the displacement between the vehicle body and the pavement. Road profile elevation measurements are obtained by summing the vehicle body movement with the appropriate body-road displacement. Profile measurements in one or both wheel paths are possible. For the Mark III, if profile elevations are measured in both wheel paths simultaneously, it is also possible to measure profile elevations in the center of the lane, even if only a laser sensor is installed in that position. IRI is calculated in accordance with procedures and specifications outlined in World Bank Technical Paper Number 46 “Guidelines for Conducting and Calibrating Road Roughness Measurements”. Ride Number is calculated using methods outlined in “Measuring & Analysing Road Profiles, National Highway Institute Short Course Manual, University of Michigan, Transportation Research Institute, October 1997”.
Rutting (Mark III only)
With a minimum of five laser sensors, a very simple lane “cross profile” and a simple, separate rut value for each wheel path can be calculated. By adding another two, four, six or more lasers (up to a total of 21), the transverse profile can be defined in greater detail, hence the rutting can be determined more accurately.
Texture
Any or both wheel path laser sensors can be of a texture-capable type employing smaller spot size and higher sampling frequency. For the Mark III the centerline laser sensor can also be texture-capable. The macrotexture statistics reported are in accordance with the established standard ‘Mean Profile Depth’ (MPD) and Root Mean Square (RMS). Both statistics are computed continuously and can be reported as close as every 100 mm (4 inches). Mean Profile Depth is measured according to ASTM E1845-01 “Standard Practice for Calculating Pavement Macrotexture Mean Profile Depth” and ISO/CD 13473-1 “Characterisation of Pavement Texture Utilising Surface Profiles”.
The profiler can also calculate the RMS (Root Mean Square) of the profile trace, which provides additional useful information regarding pavement texture (for further information, see “High-Speed Texture Measurement Of Pavements”, Kevin K. McGhee, P.E., Gerardo W. Flintsch, Ph.D., P.E., Virginia Polytechnic Institute & State University, Virginia Transportation Research Council, February 2003).
Crossfall, Grade, and Radius of Curvature (Mark III only)
By adding an Inertial Motion Sensor (IMS), collection of crossfall, grade, and highway curvature information is possible. The IMS is a microprocessor controlled, self-compensating, three-axis solid-state gyro unit. Crossfall is computed as the slope of a linear regression line through the laser elevation measurements, adjusted for roll information obtained by the gyro. Crossfall is displayed and stored in degrees.
Grade is the longitudinal slope of the lane under test. It is displayed and stored in degrees.
Radius of Curve (km or mile) and Curvature (deg/km or deg/mile) of the lane is determined in the horizontal plane. Turn rate (degrees per second) and the vehicle velocity are the basis for these computations.
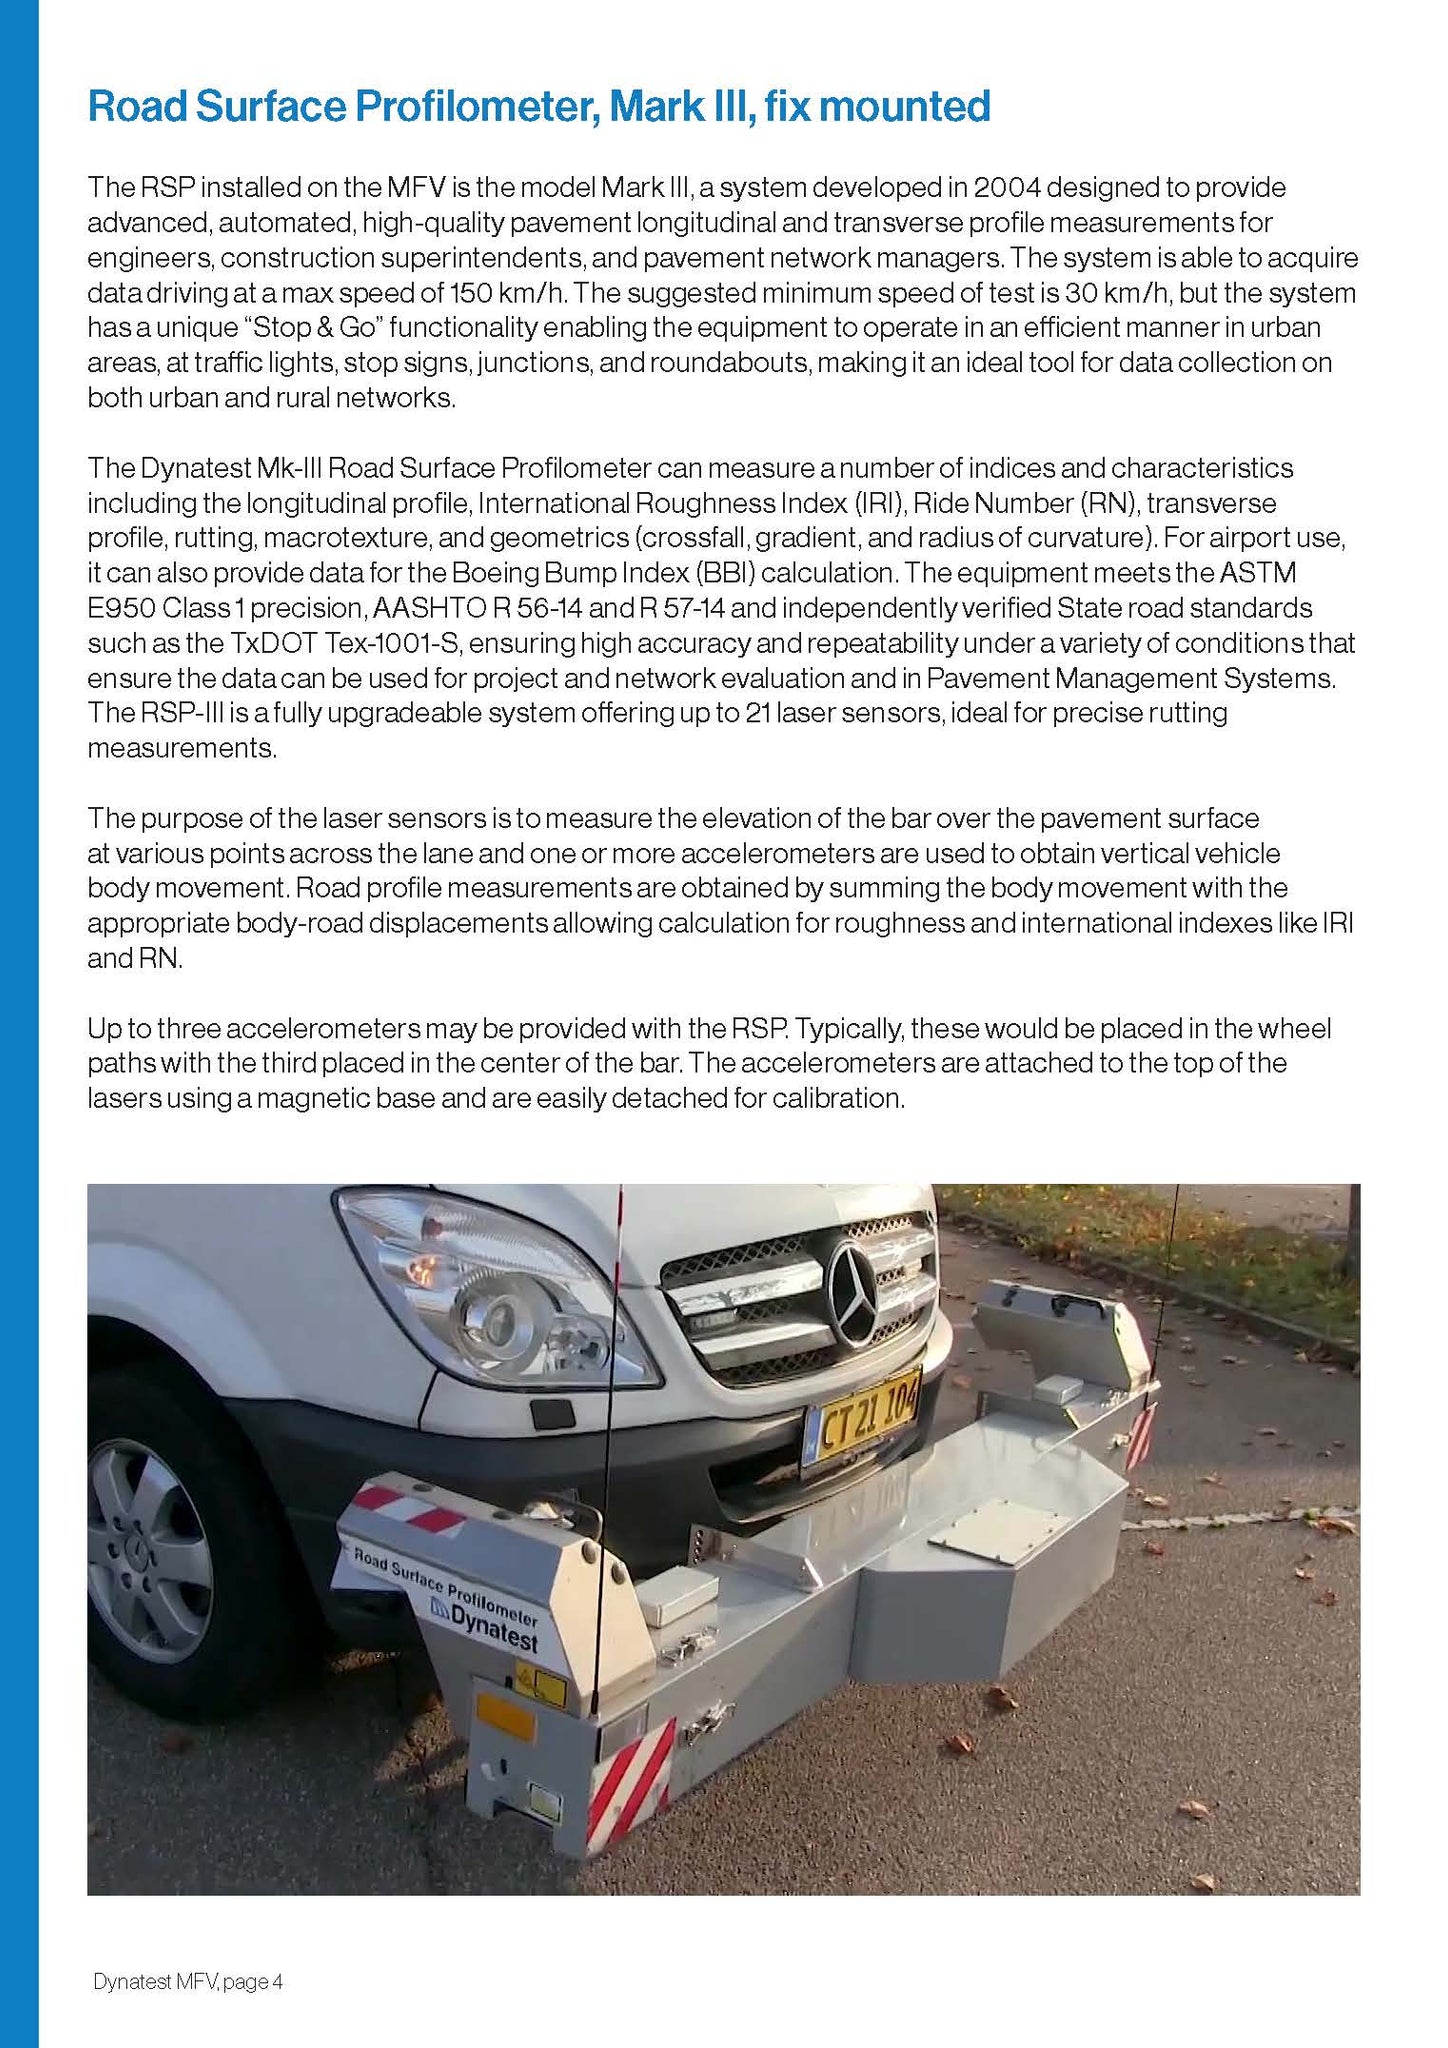
Laser Elevations and Accelerations
Raw laser elevation data (height of each laser above the pavement surface) and raw vertical acceleration can be stored at user-specified intervals. Elevations determine the Cross-Profile and are useful for verifying rut measurements or providing data from which to calculate rut depths using alternative procedures.
Faulting
Faulting on jointed concrete pavements can be detected according to “Standard Practice for Estimating Faulting of Concrete Pavements AASHTO Designation: PP39-99”. The RSP field program provides ample flexibility for the user to specify and/or modify the definition of a fault.
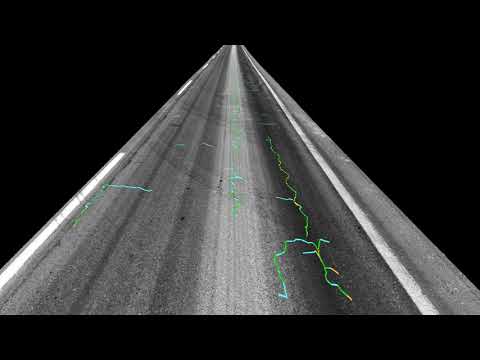
See the Laser Crack Measurement System in action
Longitudinal Profiling and IRI Option
This option enables the capture of longitudinal profile and reporting of IRI, PPF and ERD data using the LCMS-2’s built-in high-precision Inertial Measurement Units (IMUs). With this the feature the LCMS-2 is able to capture and report profile and IRI at the precision and bias of an ASTM E950 Class 1 profiler across the entire 4m lane width.
Curvature, Grade and Crossfall Option
This option enables the reporting of longitudinal grade, horizontal crossfall (cross slope), curve super elevation and water entrapment using the LCMS-2’s built-in high-precision Inertial Measurement Units (IMUs). Crossfall and water entrapment is calculated and reported according to AASHTO PP 69 (Determining Pavement Deformation Parameters and Cross Slope from Collected Transverse Profiles).
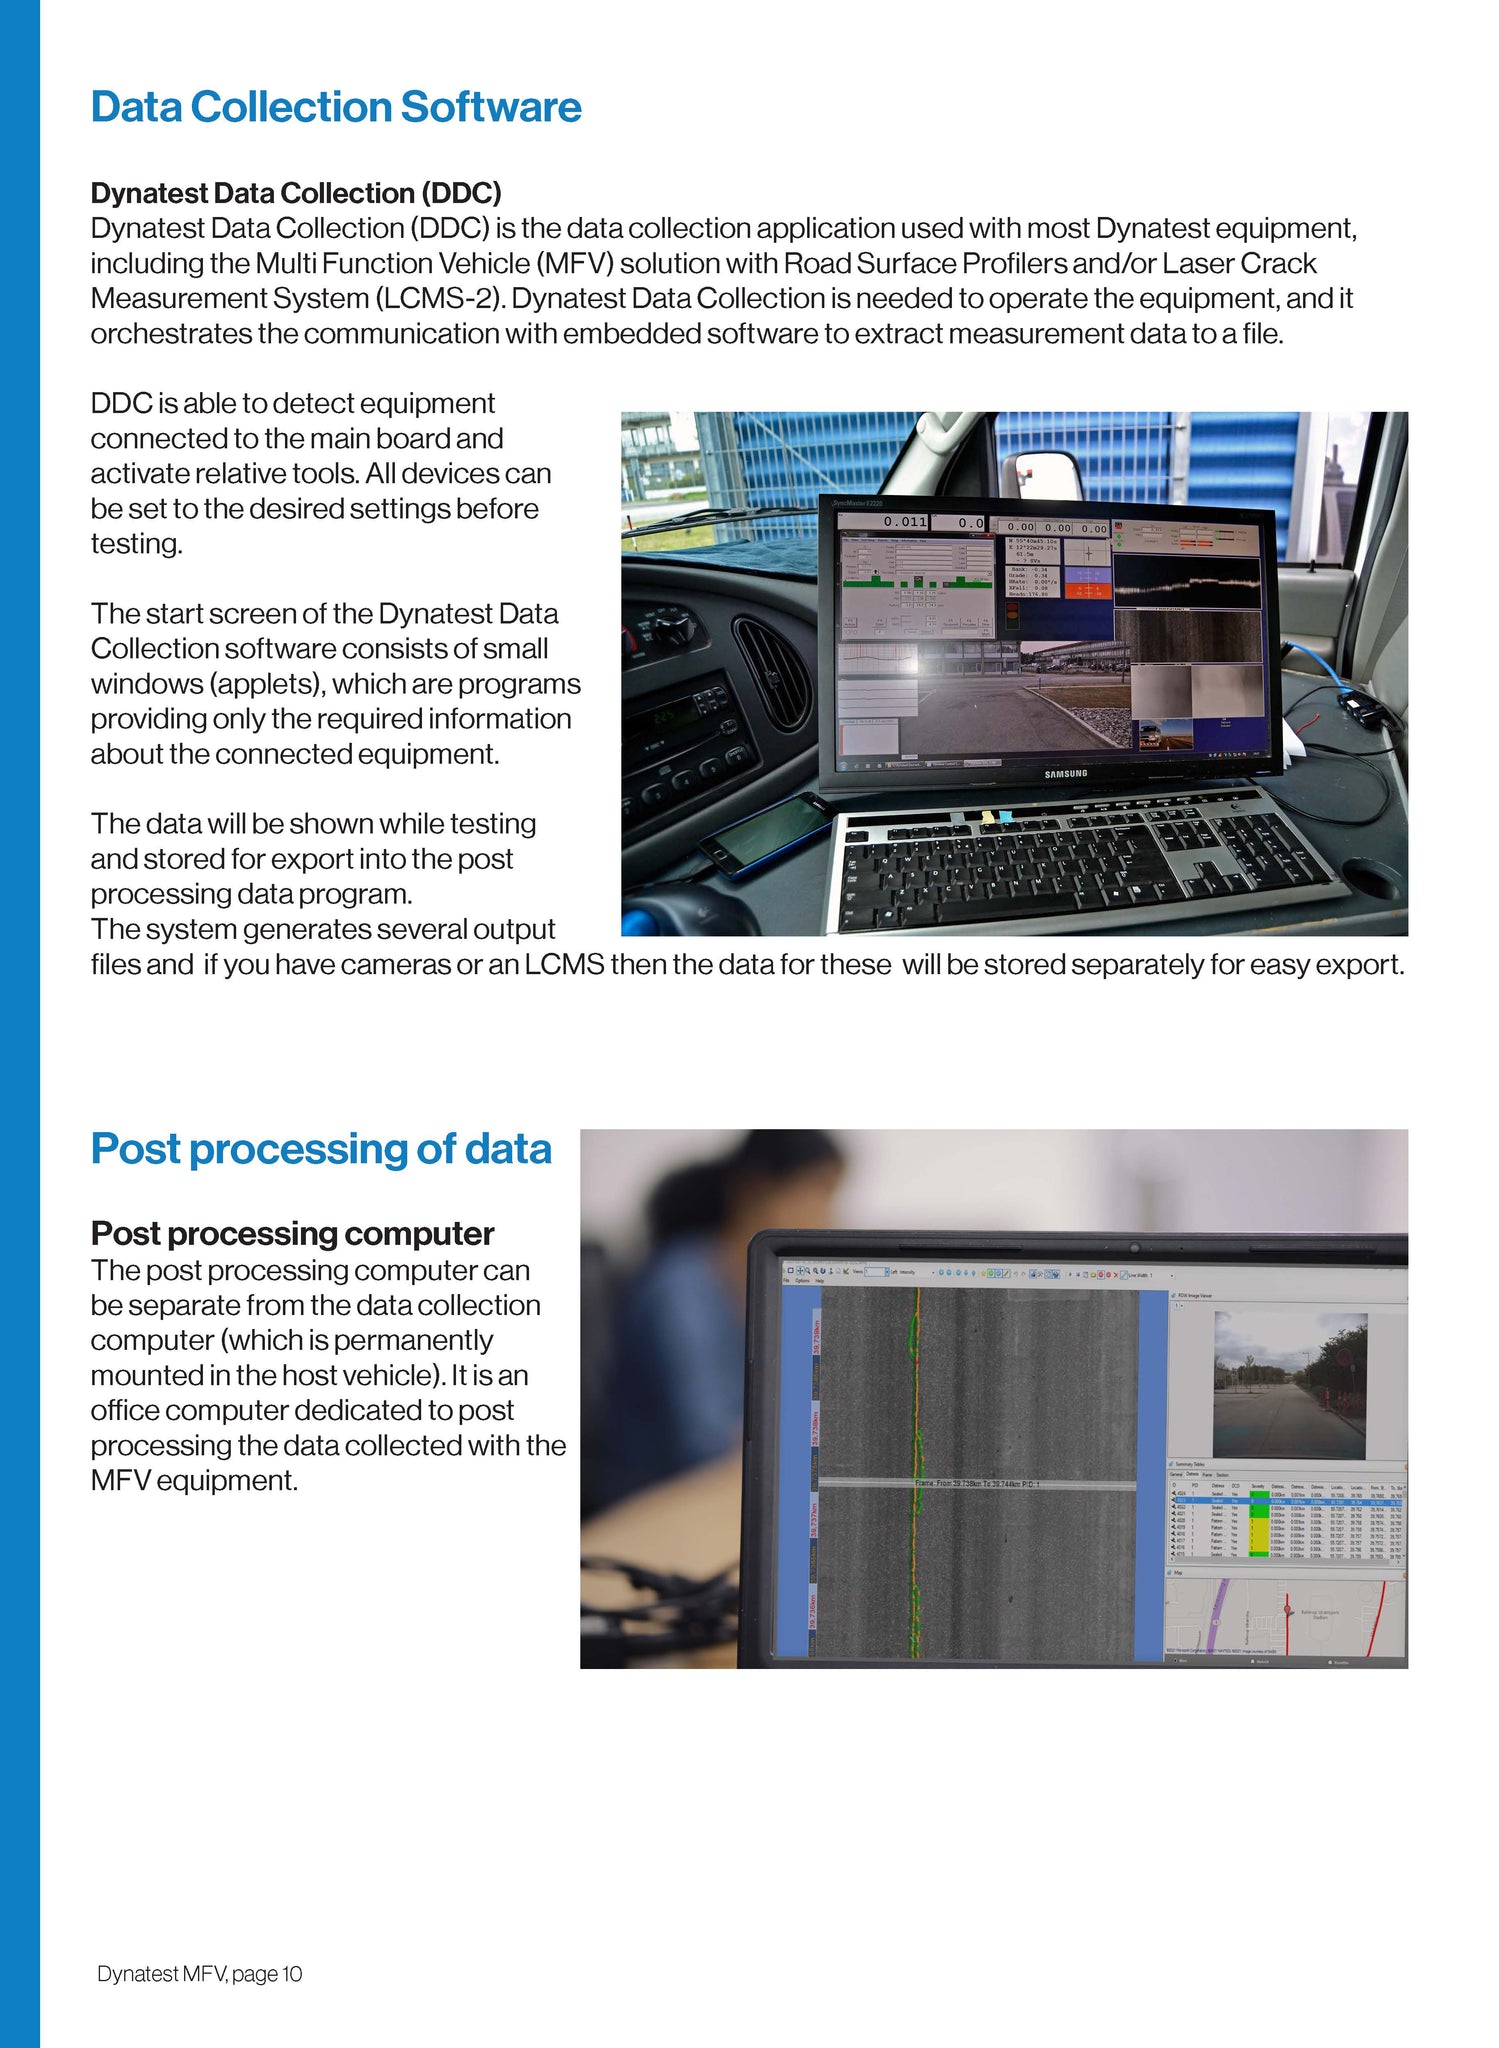
The Multi Functional Vehicle (MFV) using the Dynatest Explorer (DE) software
Dynatest Explorer (DE) is a comprehensive pavement analysis program that can provide the user with a complete overview of the pavement condition.
Dynatest Explorer is primarily used to evaluate the functional pavement condition with data from Dynatest Road Surface Profilers (RSP) or LCMS®. DE gives you access to all the data, images and distresses acquired during the survey, allowing for visualisation, verification, reviewing and reporting of results. Dynatest Explorer provides a long range of export options, including export of distresses to Microsoft Excel and Google Earth. Dynatest Explorer is a Desktop Application, that runs on Microsoft Windows 7,10 and 11 (64-bit).
Distress Rating Module (DRM)
For equipment with a Pavemetrics® Laser Crack Measurement System (LCMS®), the Distress Rating Module (DRM) in Dynatest Explorer can be used for both the automated and manual analysis of 3D and 2D pavement images, while simultaneously being able to see Right of Way (ROW) images and map location.
The Distress Rating Module uses the images from the LCMS® sensors and the distresses identified in the LCMS® data processing will automatically be added to the distress table. Using the tools provided in the Distress Rating Module it is possible to manually identify and classify distresses that may not have been detected in the automatic processing, while also being able to measure and edit the detected distresses.